Data-driven trading insights
Opening Range Breakout strategy analysis, backtested results, and market research from our team.
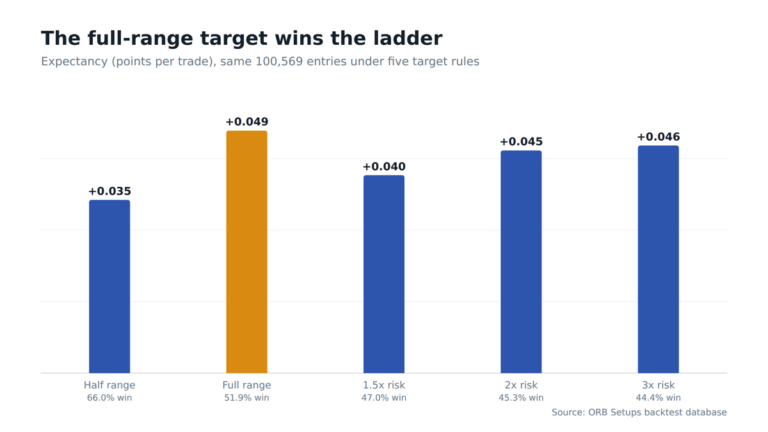
What Is the Right ORB Target? Five Rules Tested on 100,569 Identical Entries
We ran the same 100,569 opening range breakout entries through five target rules. The half-range target won 66% but earned least, stretching to 1.5x risk lost ground, and the plain full-range target made the most money.
See the data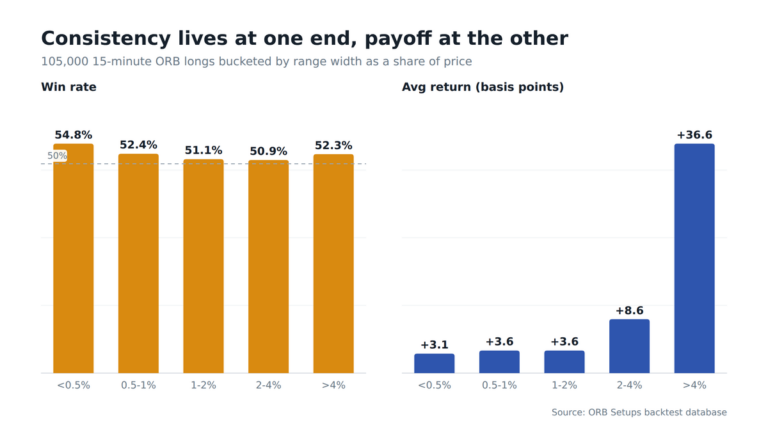
Opening Range Width: The U-Curve Hiding in 105,000 ORB Trades
We bucketed 105,000 15-minute opening range breakout trades by range width. Tight ranges won most often, ranges over 4% of price paid ten times the average, and the 1-2% middle was the dead zone.
See the data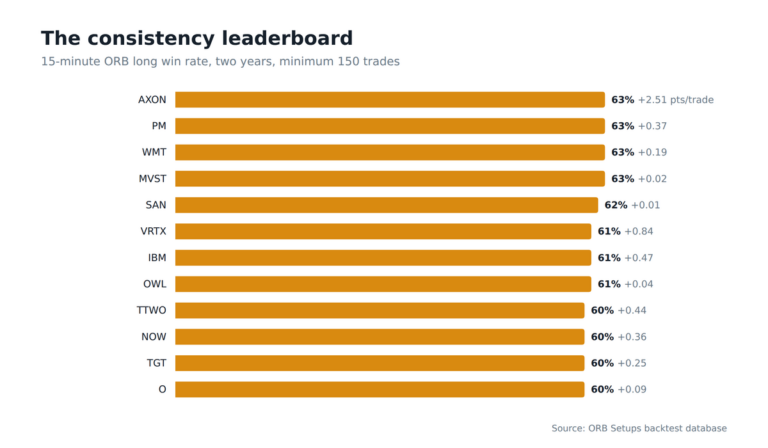
The Most Consistent ORB Stocks: A Two-Year Leaderboard
The strongest 15-minute opening range breakout performers of the last two years: twelve symbols that won 60% or better across 150-plus trades each, and why win rate alone is only half the story.
See the data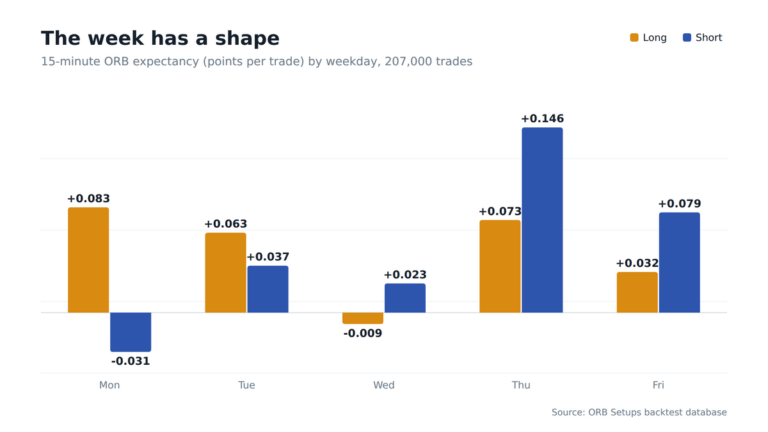
The Best Day of the Week for ORB Trades: 207,000 Backtests by Weekday
We split 207,000 15-minute opening range breakout trades by weekday and direction. Monday favored longs, Wednesday quietly flipped to shorts, and Thursday delivered the best expectancy of the week on both sides.
See the data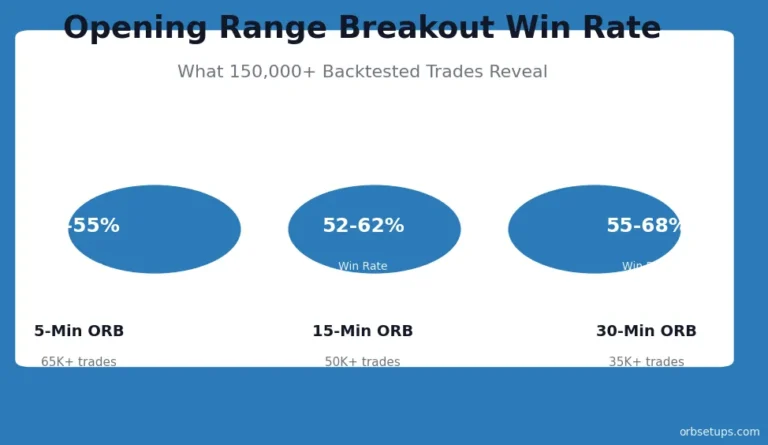
Opening Range Breakout Win Rate: What 150,000+ Trades Reveal About ORB Strategy Performance
Across 190,000+ ORB trades on 611 stocks and ETFs, 15-minute opening range win rates average 52.2% to 52.9% by timeframe, and top symbols clear 88%. Why win rate alone misleads, and how expectancy fixes it.
See the data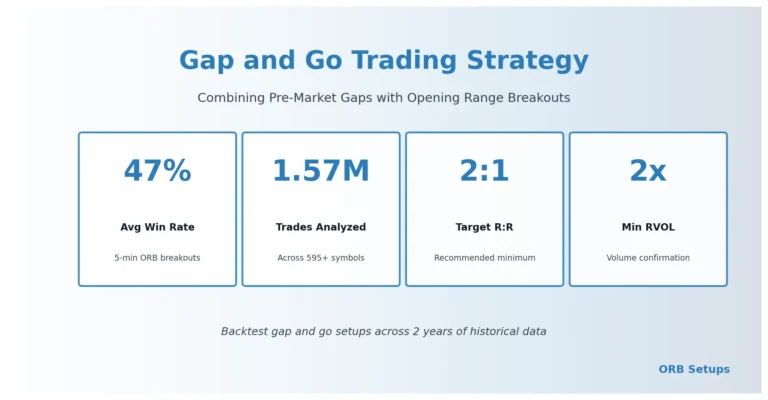
Gap and Go Trading Strategy: How to Combine Pre-Market Gaps with Opening Range Breakouts
Gap and go strategy combines pre-market gaps with opening range breakouts. Learn entry rules, stop placement, and profit targets with backtested data.
See the dataATR-Based Position Sizing for Day Traders: The Math Behind Smarter ORB Trades
ATR position sizing uses Dollar Risk / (ATR x ATR Multiple) to calculate shares. Backtest data shows 18% lower drawdowns vs fixed sizing on ORB trades.
See the data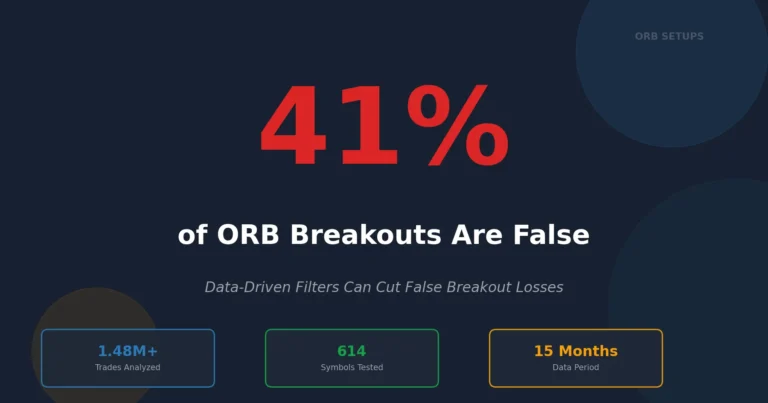
How to Identify and Avoid False Breakouts: A Data-Driven Approach
How to spot false opening range breakouts using volume, range width and time of day. A half-range target wins about two thirds of the time, but each win is half the size.
See the data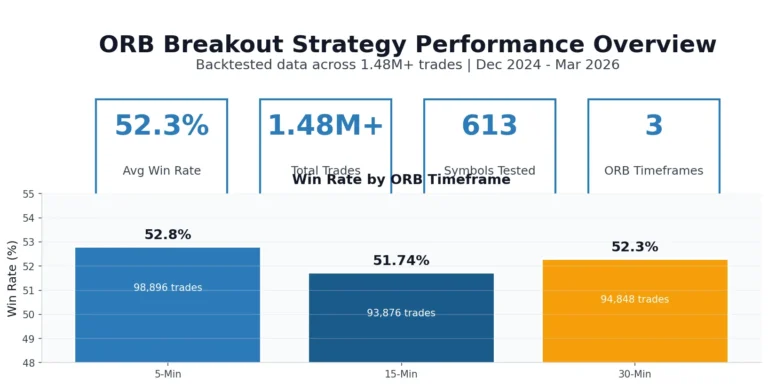
Pre-Market Analysis for ORB Trading: How to Select High-Probability Setups Before the Open
Pre-market analysis filters ORB setups by gap size, volume, and news catalysts. Learn the step-by-step workflow to build your watchlist before market open.
See the data
5-Minute vs 15-Minute vs 30-Minute Opening Range: Which Timeframe Has the Best Win Rate?
We backtested 1,178,668 ORB trades across 614 symbols. 5-min wins 53.78%, 15-min wins 50.97%, 30-min wins 49.38%. Full data breakdown inside.
See the data