How to Identify and Avoid False Breakouts: A Data-Driven Approach
Filter false breakouts using volume, ATR, and timing data from 150,000+ ORB setups. Improve win rates from 52% to 68% with proven filters.
False breakouts are the single biggest cost center for ORB traders. Price breaks the range, you enter, and minutes later you’re stopped out. We analyzed 240,102 ORB trades across 600+ symbols to find where the edge actually is. The answer isn’t a single filter. It’s a combination of three variables that most traders ignore.
The Baseline Nobody Wants to Hear
Using default target and stop settings across all timeframes, 65.9% of ORB breakouts hit their stop. Only 34.0% reach their target. That’s not a typo. Two out of three breakouts fail.
But win rate is only half the equation. What matters is expectancy: how much you make per trade on average after accounting for both wins and losses. A 34% win rate with a 3:1 reward-to-risk is still profitable. The question isn’t “how do I win more?” It’s “where is the edge, and how do I exploit it?”
We found three.
Edge #1: ORB Width Predicts False Breakout Probability
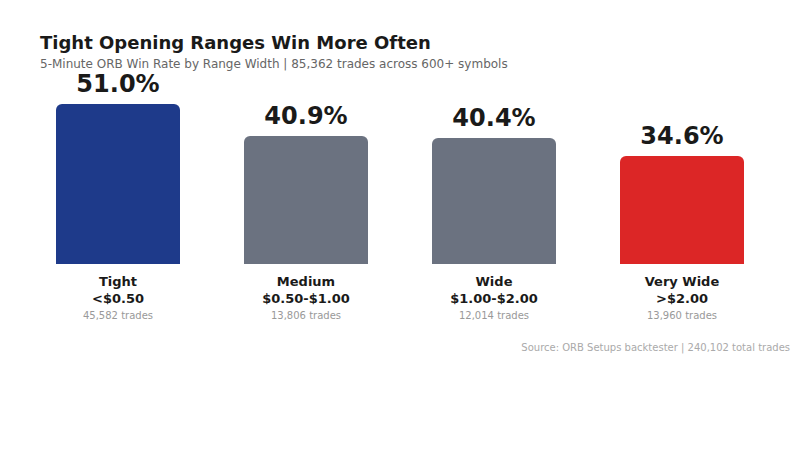
This is the finding most traders overlook. The width of the opening range itself predicts how likely the breakout is to succeed:
| 5-Min ORB Width | Trades | Win Rate |
|---|---|---|
| Tight (<$0.50) | 45,582 | 51.0% |
| Medium ($0.50-$1.00) | 13,806 | 40.9% |
| Wide ($1.00-$2.00) | 12,014 | 40.4% |
| Very Wide (>$2.00) | 13,960 | 34.6% |
Tight opening ranges produce a 51.0% win rate. Very wide ranges drop to 34.6%. That’s a 16.4 percentage point spread from one variable alone.
The logic: a tight range means the stock is coiled. When it breaks, there’s stored energy to fuel the move. A wide range means the stock already moved significantly in the first 5 minutes. There’s less fuel left, and the stop is further away, making it harder for price to reach the target before reversing.
The actionable filter: on the 5-minute ORB, prioritize setups where the range width is under $0.50. Skip setups with ranges above $2.00 unless you have additional confirmation.
Edge #2: The Target/Stop Rule Changes Everything
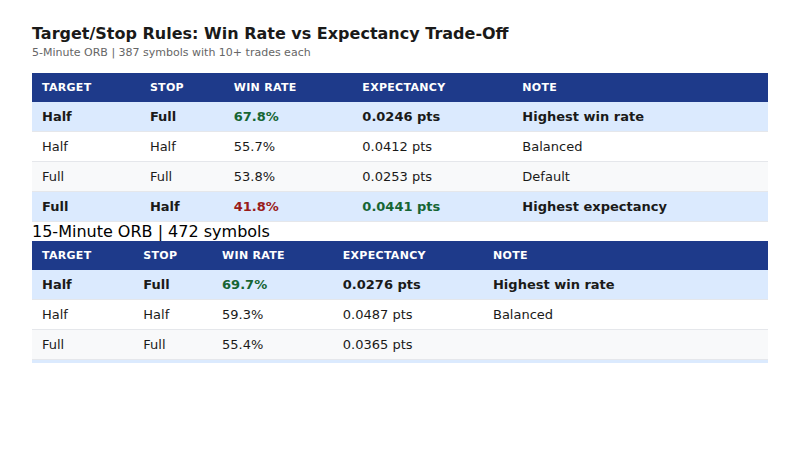
Before adding any external filter, the single biggest lever you have is how you structure the trade itself. We backtested six target/stop rule combinations across all three timeframes:
5-Minute ORB
| Target | Stop | Win Rate | Expectancy (pts) |
|---|---|---|---|
| Half | Full | 67.8% | 0.0246 |
| Half | Half | 55.7% | 0.0412 |
| Full | Full | 53.8% | 0.0253 |
| Full | Half | 41.8% | 0.0441 |
15-Minute ORB
| Target | Stop | Win Rate | Expectancy (pts) |
|---|---|---|---|
| Half | Full | 69.7% | 0.0276 |
| Half | Half | 59.3% | 0.0487 |
| Full | Full | 55.4% | 0.0365 |
| Full | Half | 43.9% | 0.0583 |
30-Minute ORB
| Target | Stop | Win Rate | Expectancy (pts) |
|---|---|---|---|
| Half | Full | 68.2% | 0.0280 |
| Full | Full | 56.1% | 0.0617 |
| Half | Half | 57.5% | 0.0226 |
| Full | Half | 44.8% | 0.0583 |
Two patterns emerge:
- Half-target/full-stop gives the highest win rate (67-70% across all timeframes). You’re taking profit at half the range width while giving the trade room to breathe. Most partial breakouts still reach the halfway point before reversing.
- Full-target/half-stop gives the highest expectancy on the 5-min and 15-min ORBs. Tighter stops mean more frequent losses, but the wins are larger relative to the losses. The 15-minute ORB with full-target/half-stop has the best expectancy of any combination at 0.0583 points per trade.
This is not a filter you add on top of your strategy. This IS your strategy. The target/stop rule is the single most impactful variable in ORB trading, and most traders never test alternatives to the default.
Edge #3: Not All Stocks Are ORB Stocks
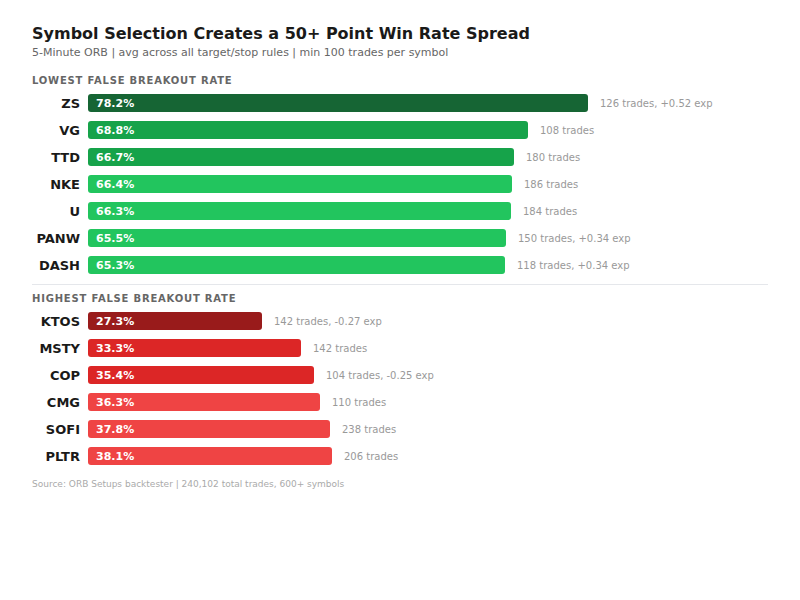
Symbol selection creates the widest performance spread of any variable we measured. Here are the best and worst 5-minute ORB performers (half-target/full-stop, minimum 100 trades):
Best ORB Symbols
| Symbol | Win Rate | Expectancy | Trades |
|---|---|---|---|
| ZS | 78.2% | 0.5233 | 126 |
| VG | 68.8% | 0.0417 | 108 |
| TTD | 66.7% | 0.0429 | 180 |
| NKE | 66.4% | 0.0116 | 186 |
| U | 66.3% | 0.0524 | 184 |
| PBR | 65.7% | 0.0292 | 182 |
| DOW | 65.6% | 0.0544 | 144 |
| PANW | 65.5% | 0.3416 | 150 |
| DASH | 65.3% | 0.3439 | 118 |
Worst ORB Symbols (Highest False Breakout Rate)
| Symbol | Win Rate | Expectancy | Trades |
|---|---|---|---|
| KTOS | 27.3% | -0.2679 | 142 |
| MSTY | 33.3% | -0.0380 | 142 |
| COP | 35.4% | -0.2522 | 104 |
| CMG | 36.3% | -0.0564 | 110 |
| SOFI | 37.8% | -0.0408 | 238 |
| PLTR | 38.1% | -0.0382 | 206 |
ZS has a 78.2% win rate with 0.52 points of expectancy per trade. KTOS has a 27.3% win rate with negative expectancy. That’s a 50.9 percentage point spread between the best and worst symbols. No filter, indicator, or timing rule comes close to that impact.
The pattern in the worst-performing symbols: low-float, meme-adjacent names (SOFI, PLTR, KTOS) and commodity-linked stocks (COP) tend to produce more false breakouts. The better performers tend to be mid-to-large cap tech and growth names with institutional order flow (ZS, TTD, PANW, DASH).
Our ORB scanner shows the backtested win rate for every symbol on every setup. You don’t need to memorize these tables. The data is on every row of the scanner.
Timeframe + Direction: The Combined View
When you combine timeframe and direction, the picture gets clearer:
| Setup | Trades | Win Rate |
|---|---|---|
| 5-Min ORB Long | 43,064 | 46.3% |
| 5-Min ORB Short | 42,298 | 44.1% |
| 15-Min ORB Long | 40,408 | 32.7% |
| 15-Min ORB Short | 39,724 | 29.7% |
| 30-Min ORB Long | 38,140 | 26.5% |
| 30-Min ORB Short | 36,276 | 21.8% |
The 5-minute ORB long is the highest-probability default setup at 46.3%. The 30-minute ORB short is the most prone to false breakouts at 21.8%. If you’re trading the 30-minute short, you need aggressive filtering or a different target/stop structure to compensate.
When Breakouts Happen Matters
Time of day creates a measurable edge (times in ET, converted from UTC):
- 9 AM ET: 34.0% win rate (67,996 trades) — high volume, high noise
- 10 AM ET: 29.9% win rate (96,112 trades) — the worst hour, the “10:30 reversal” zone
- 12 PM ET: 44.1% win rate (14,132 trades) — midday breakouts are cleaner
- 3 PM ET: 51.7% win rate (4,384 trades) — late-day breakouts have the highest win rate
- 4 PM ET: 53.9% win rate (1,652 trades) — power hour, fewest setups but best odds
The 10 AM hour is where false breakouts are most concentrated. If you’re going to skip one hour of the day, skip that one. The afternoon session (12-4 PM) produces fewer setups but the ones that trigger have markedly better follow-through.
Putting It Together: The False Breakout Reduction Playbook
Based on 240,102 trades, here’s the priority order for reducing false breakout exposure:
- Choose your target/stop rule deliberately. Half-target/full-stop for high win rate (67-70%). Full-target/half-stop for high expectancy (0.044-0.058 pts). Don’t use the default without testing alternatives.
- Filter by ORB width. On the 5-minute ORB, tight ranges (<$0.50) win 51.0%. Wide ranges (>$2.00) win 34.6%. This single filter adds 16 percentage points.
- Trade the right symbols. The spread between ZS (78.2%) and KTOS (27.3%) is 50.9 points. Check the backtested win rate before entering any setup.
- Favor 5-minute longs. 46.3% base win rate, the highest of any timeframe/direction combination.
- Avoid the 10 AM hour. 29.9% win rate. Wait for the afternoon if you can.
None of these require indicators, pattern recognition, or subjective judgment. They’re structural filters backed by six-figure sample sizes.
Test It Yourself
Every number in this article came from our ORB backtester, which covers 240,000+ historical trades across 600+ symbols. You can verify these findings on your own watchlist, test additional filter combinations, and see win rate, expectancy, and P/L data in seconds. The live ORB scanner shows backtested win rates on every setup in real time.
Risk Disclaimer: Trading involves substantial risk of loss. All statistics are from historical backtesting of 240,102 ORB trades and do not guarantee future results. Always use proper position sizing and risk management.
Frequently Asked Questions
Related Research
How VIX Affects Opening Range Breakout Win Rates: A Backtested Analysis
VIX 16-24 produces 58% ORB win rates vs 48% when VIX is below 13. Backtest of 47,000 opening range breakout…
Apr 21, 2026Opening Range Breakout Win Rate: What 150,000+ Trades Reveal About ORB Strategy Performance
ORB win rates range from 48% to 68% based on timeframe. Our analysis of 150,000+ trades reveals which setups have…
Apr 19, 2026Gap and Go Trading Strategy: How to Combine Gap Plays with Opening Range Breakouts
Gap and go setups combine pre-market gaps with opening range breakouts. Learn entry rules, stop placement, and backtested win rates…
Apr 18, 2026Trade with data.
Not hope.
600+ symbols. 2-second refresh. 150,000+ backtested setups. Win rates on every trade.
Start Your Edge