Symbol Charts
Opening Range Breakout levels, plotted live
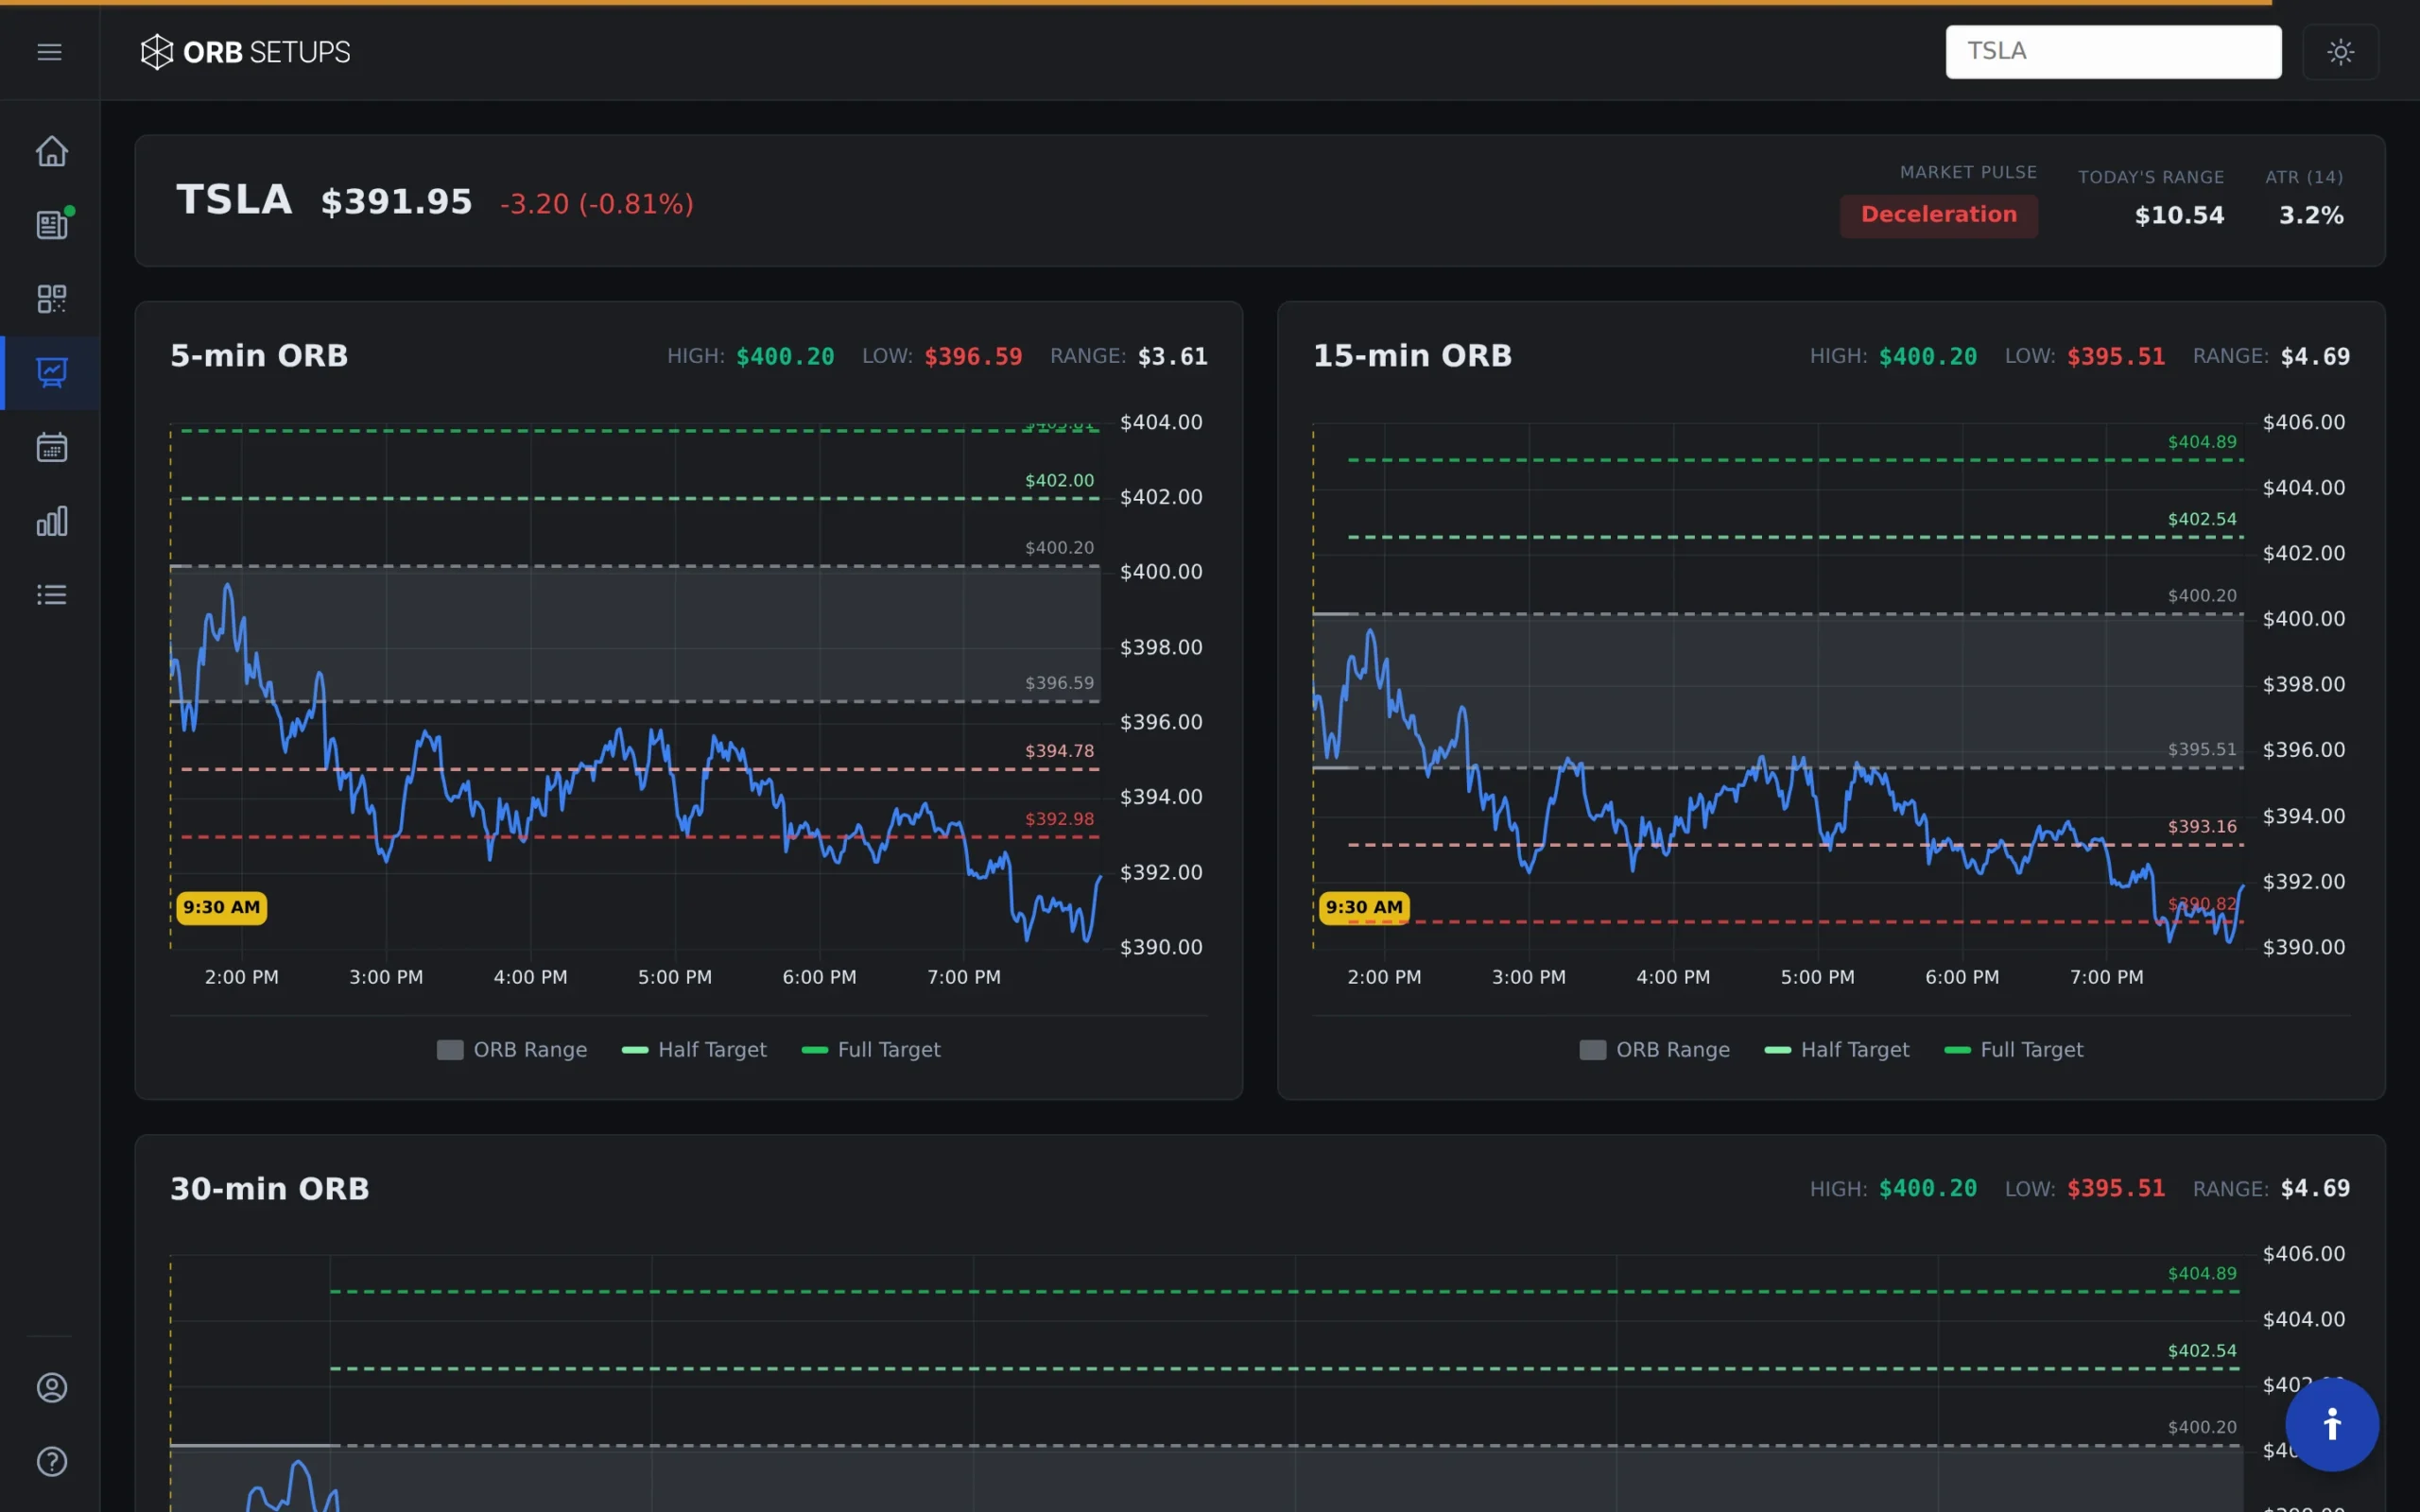
Interactive intraday charts with ORB high, low, half targets, and full targets plotted in real-time. View all three timeframes side by side for any symbol.

Three Timeframes
5-minute, 15-minute, and 30-minute ORB charts side by side. Compare range widths and breakout levels.
Live Levels
ORB high, low, entry, target, and stop plotted on the chart. Updated in real-time during market hours.
Any Symbol
Type any symbol in the scanner universe and see its ORB chart instantly. 600+ stocks and ETFs available.
Ready to trade with real data?
600+ symbols. 2-second refresh. Backtested win rates on every setup.
Get Started