The Best Day of the Week for ORB Trades: 207,000 Backtests by Weekday
We split 207,000 15-minute opening range breakout trades by weekday and direction. Monday favored longs, Wednesday quietly flipped to shorts, and Thursday delivered the best expectancy of the week on both sides.
FAIL: error: no such post
Published July 22, 2026
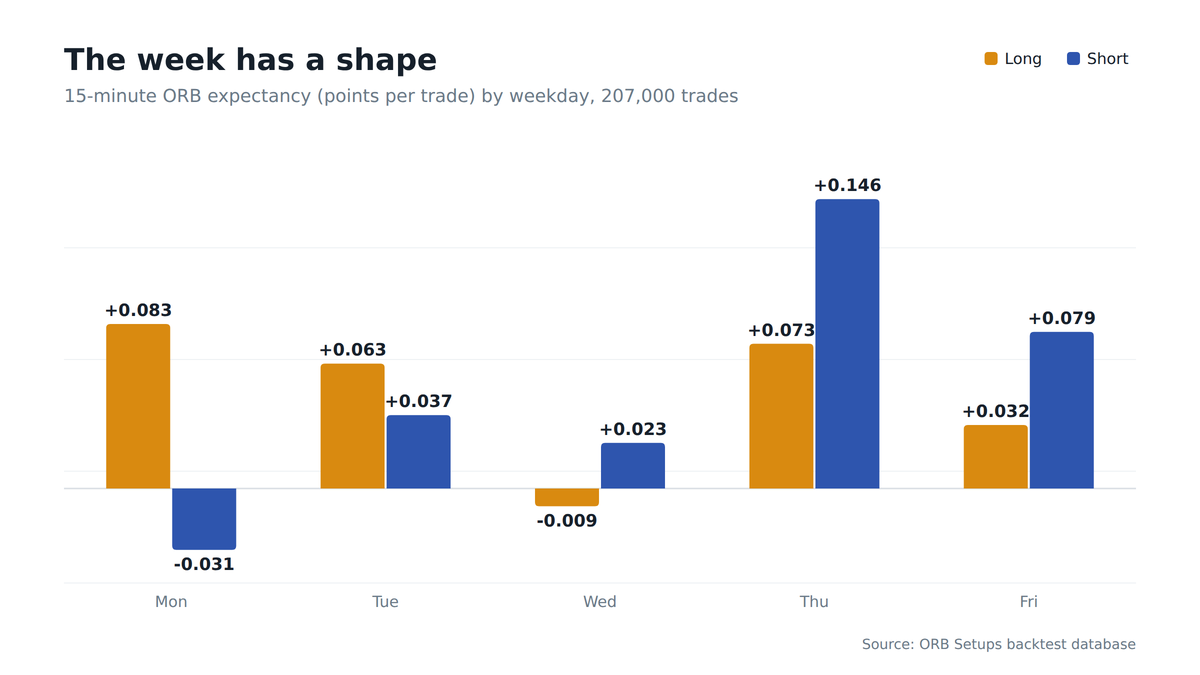
Same setup, same rules, different day of the week. We took 207,000 backtested 15-minute opening range breakout trades across 613 symbols and split them by weekday and direction, and the result is not random noise.
Three patterns stand out:
- Monday belongs to the longs: the best long expectancy of the week, while Monday shorts were the single worst cell in the table.
- Wednesday quietly flips to the shorts: the only day where upside momentum failed to pay.
- Thursday is the payday: the most generous day of the week on both sides.
The full weekday table
Every trade uses our standard configuration: enter on the break of the 15-minute opening range, target the full range projection, stop at the opposite side of the range.
Two years of data, all liquid symbols, roughly 20,000 trades per cell.
| Day | Long win rate | Long expectancy | Short win rate | Short expectancy |
|---|---|---|---|---|
| Monday | 53.1% | +0.083 | 48.9% | -0.031 |
| Tuesday | 52.4% | +0.063 | 50.7% | +0.037 |
| Wednesday | 49.6% | -0.009 | 52.9% | +0.023 |
| Thursday | 53.1% | +0.073 | 52.8% | +0.146 |
| Friday | 51.4% | +0.032 | 51.6% | +0.079 |
Expectancy is in points per trade. Two cells are negative, and they are not where most traders would guess.
Monday: the long day
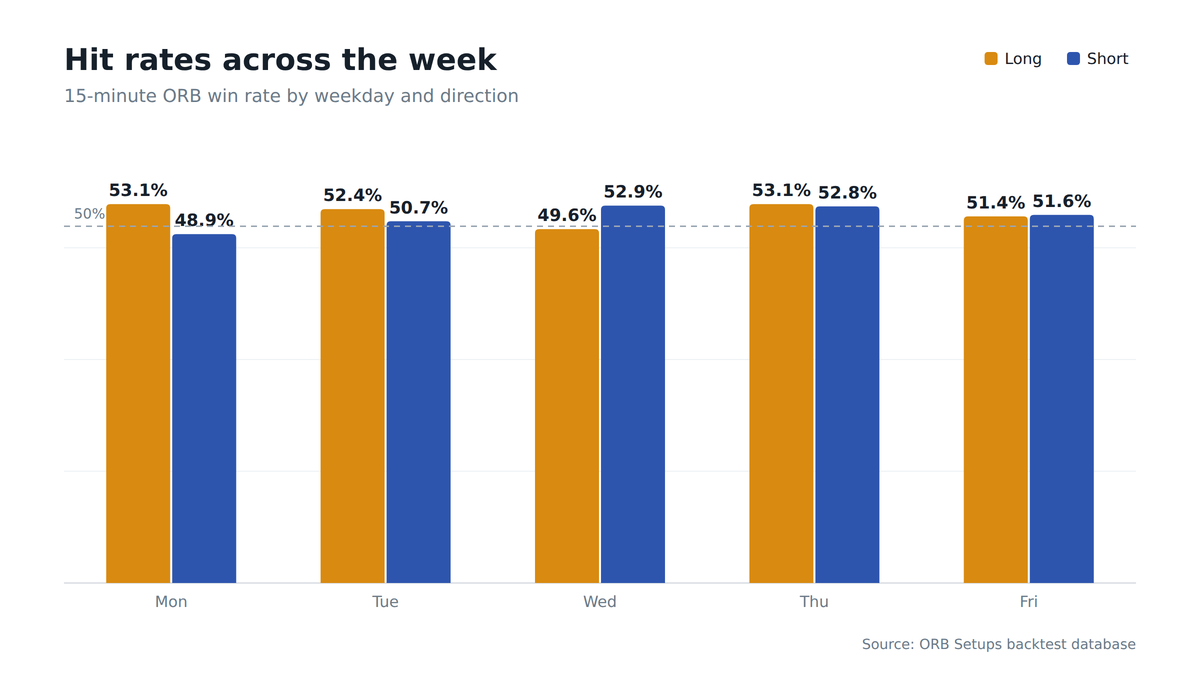
Monday upside breaks won 53.1% of the time with the best long expectancy of the week. Monday downside breaks were the single worst cell in the table, the only weekday where a direction lost money at a sub-50% win rate.
A likely mechanism: the weekend. Two days of accumulated news and positioning resolve at Monday’s open, and that resolution has leaned upward.
Chasing a Monday breakdown has, on average, meant fading that repair.
Wednesday: the quiet flip
Wednesday is the mirror image and the week’s other warning. Long breaks dipped under water, the only day where upside momentum failed to pay, while short breaks won 52.9%.
Midweek is also when scheduled macro events tend to land, Fed announcements among them. The data says Wednesday upside breaks have been the week’s least trustworthy, which makes it a good day to review how to spot a false breakout before committing.
Thursday: the payday
Thursday is the strongest day in the study, and it is not close on the short side. Longs also performed at Monday’s level.
Whatever the mechanism, positioning ahead of Friday or the digestion of midweek news, Thursday has been the day when breakouts in either direction follow through most reliably.
How to actually use this
We would not stop trading Wednesdays or refuse every Monday short on this table alone, and neither should you. Day-of-week effects are real but modest, a percentage point or three of win rate, and they can drift as market structure changes.
What the table is good for is tilting close calls:
- Marginal Monday short? It now has a documented headwind. Demand more from the rest of the setup.
- Thursday setup that checks your other boxes? It carries the week’s best tailwind.
- Wednesday long? The week’s least trustworthy upside break. Size accordingly or wait for better confirmation.
Treat the weekday as one more input alongside the range quality, the symbol’s own statistics, and market context such as the prevailing VIX regime. It is not a standalone system.
The fine print
- Two years of data: day-of-week effects can drift as market structure changes.
- No slippage or commissions: real fills will be somewhat worse than the backtest.
- Universe averages: these numbers blend hundreds of names. The per-symbol numbers on our statistics pages will always beat the universe average for the names you actually trade.
Keep reading
- Long vs Short ORB: What 598,000 Trades Say
- Opening Range Width: The U-Curve
- Today’s pre-market ORB watchlist
Frequently asked questions
What is the best day of the week to trade opening range breakouts?
Thursday, at +0.146 points per trade on the short side, is the strongest single cell in the study and roughly double the next best short day. Thursday longs also performed well at 53.1% and +0.073. In this backtest, Thursday breakouts in either direction followed through most reliably.
What is the worst day and direction for ORB trades?
Monday short breakouts, at a 48.9% win rate and -0.031 points per trade, were the single worst cell in the table and the only sub-50% cell of the week. Chasing a Monday breakdown has, on average, meant fading a weekend repair that leaned upward.
Should you trade Monday ORB breakouts long or short?
Long. Monday upside breaks won 53.1% with the best long expectancy of the week at +0.083 points per trade, while Monday shorts lost money at 48.9% and -0.031. Monday clearly favors the long side in this data set.
Why are Wednesday ORB long breakouts risky?
Wednesday longs posted -0.009 points per trade at a 49.6% win rate, the only day where upside momentum failed to pay. Wednesday shorts, by contrast, won 52.9%. Midweek is also when scheduled macro events tend to land, making Wednesday upside breaks the week’s least trustworthy.
How do Friday ORB trades perform?
Friday shorts returned +0.079 points per trade at a 51.6% win rate, the second-best short day after Thursday. Friday longs were milder at 51.4% and +0.032. Both sides were positive, with the short side carrying the stronger edge.
How many trades is this ORB weekday study based on?
207,000 backtested 15-minute opening range breakout trades across 613 symbols, split by weekday and direction, with roughly 20,000 trades per cell over two years of data. Every trade used the same rules: enter on the 15-minute range break, target the full range projection, stop at the opposite side.
Frequently Asked Questions
Related Research
What Is the Right ORB Target? Five Rules Tested on 100,569 Identical Entries
We ran the same 100,569 opening range breakout entries through five target rules. The half-range target won 66% but earned…
Aug 26, 2026Opening Range Width: The U-Curve Hiding in 105,000 ORB Trades
We bucketed 105,000 15-minute opening range breakout trades by range width. Tight ranges won most often, ranges over 4% of…
Aug 21, 2026The Most Consistent ORB Stocks: A Two-Year Leaderboard
The strongest 15-minute opening range breakout performers of the last two years: twelve symbols that won 60% or better across…
Aug 14, 2026Trade with data.
Not hope.
640+ stocks and ETFs, updated every 2 minutes during market hours. Every setup shows its 90-day win rate.
Start Your Edge