Pre-Market Analysis for ORB Trading: How to Select High-Probability Setups Before the Open
Pre-market analysis filters ORB setups by gap size, volume, and news catalysts. Learn the step-by-step workflow to build your watchlist before market open.
Pre-market analysis separates profitable ORB traders from those who chase every breakout. The opening range forms within the first 5, 15, or 30 minutes of market open. Your preparation before that window determines whether you enter high-probability setups or waste capital on false breakouts.
We analyzed over 150,000 historical ORB setups across 595+ stocks and ETFs. The data reveals clear patterns that identify which pre-market conditions produce the best breakout opportunities. This guide walks you through the exact pre-market analysis process we use to filter setups before the bell.
Why Pre-Market Analysis Matters for ORB Success
The opening range breakout strategy depends on morning volatility. Pre-market activity directly influences how the opening range forms and whether breakouts have follow-through. Traders who skip pre-market analysis miss critical context that affects win rates.
ORB win rates vary significantly based on pre-market conditions. Stocks with elevated pre-market volume historically show stronger breakout momentum compared to those with quiet pre-market sessions. Gap size, news catalysts, and sector rotation all factor into setup quality.
Our backtesting data shows that filtered ORB setups outperform unfiltered ones by a measurable margin. The filtering happens before market open when you build your watchlist and identify which stocks deserve your attention during the first 30 minutes.
Key Pre-Market Indicators for ORB Setup Selection
Pre-market analysis for ORB trading requires tracking specific data points. Each indicator provides information about potential breakout quality and expected move size.
Pre-Market Volume and Relative Volume
Pre-market volume relative to average volume signals institutional interest. Stocks showing 2x or higher relative volume in pre-market tend to produce cleaner opening ranges. The volume indicates that participants are positioning before the open, which typically means more decisive price action.
We track pre-market volume as a percentage of average daily volume. A stock that trades 500,000 shares pre-market when its daily average is 2 million (25% of daily volume before market open) deserves attention. This level of activity suggests a meaningful move is developing.
Gap Analysis and Gap Percentage
Gap size affects opening range dynamics. Large gaps (over 3%) often see gap fills during the first hour, which changes how you trade the opening range. Small gaps (under 1%) may not have enough momentum for a clean ORB setup.
Gap direction matters for trend alignment. Stocks gapping up in an uptrending market sector show higher ORB win rates than counter-trend gaps. We analyze gap percentage alongside sector performance to identify setups where momentum aligns with broader market direction.
News and Catalyst Identification
News-driven gaps produce different ORB characteristics than technical gaps. Earnings reports, analyst upgrades, FDA approvals, and sector news all create unique opening range patterns. Identifying the catalyst helps project how price might behave after the range forms.
Earnings gaps require extra caution. Post-earnings ORB setups often see extended moves but also increased reversal risk. We flag earnings-related setups separately and apply tighter risk management rules during the first trading day after announcements.
Building Your Pre-Market Watchlist
Effective pre-market analysis produces a focused watchlist before the opening bell. We recommend limiting your watchlist to 5 to 10 stocks maximum. More than that spreads attention too thin during the fast-moving opening range period.
Screening Criteria for ORB Candidates
Start with stocks meeting baseline liquidity requirements. We filter for minimum average daily volume of 1 million shares and average true range (ATR) above $1.00. These thresholds ensure adequate liquidity for entries and exits and enough movement to justify the trade.
Add pre-market activity filters. Stocks showing pre-market volume above 100,000 shares and price movement of at least 1% make the initial cut. This identifies names where something is happening before the open.
Sector and Market Context
Pre-market futures indicate overall market direction. When S&P 500 futures gap up 0.5% or more, long ORB setups in strong sectors historically outperform. Aligning your ORB direction with market trend improves baseline win rates.
Sector rotation analysis adds another filter layer. Technology stocks leading in a risk-on environment deserve priority over defensive sectors. We check sector ETF pre-market performance (XLK, XLF, XLE) to identify where institutional money is flowing.
Technical Level Confluence
Stocks approaching significant technical levels during pre-market deserve extra attention. A stock gapping up to test its 52-week high creates a high-probability ORB setup if price breaks that level in the opening range.
We mark key levels on our watchlist stocks: prior day high/low, 52-week levels, and major moving averages. When the opening range forms near these levels, breakouts tend to produce cleaner follow-through due to stop-loss triggers and technical breakout buyers joining the move.
Pre-Market Analysis Workflow: Step by Step
A structured pre-market routine ensures you identify the best ORB candidates consistently. We follow this workflow daily starting at 7:00 AM Eastern.
7:00 AM: Initial Gap Scan
Run a gap scan identifying all stocks gapping 1% or more with pre-market volume above 50,000 shares. This produces a raw list of 20 to 50 candidates depending on market conditions. Record gap percentage and direction for each.
7:30 AM: News Review
Review news headlines for each gap scan result. Categorize gaps as earnings-related, analyst-driven, sector news, or technical. Remove stocks with ambiguous or stale news catalysts. Reduce the list to 15 to 25 names.
8:00 AM: Technical Analysis
Pull up daily charts for remaining candidates. Mark prior support/resistance, check trend direction, and note proximity to major moving averages. Flag stocks where the gap aligns with technical breakout levels. Narrow to 10 to 15 stocks.
8:30 AM: Volume Confirmation
Check relative volume one final time. Stocks showing sustained pre-market volume (not just an early spike that faded) move to the final watchlist. Target 5 to 10 stocks ranked by setup quality.
9:00 AM: Level Setup
For each final watchlist stock, mark the pre-market high and low. These often become the opening range boundaries or provide reference points for the first 5, 15, or 30-minute range. Set alerts at key levels.
Using Backtested Data for Pre-Market Filtering
Historical performance data adds an objective layer to pre-market analysis. Not all stocks behave the same during opening range breakouts. Backtested win rates reveal which symbols historically produce reliable setups.
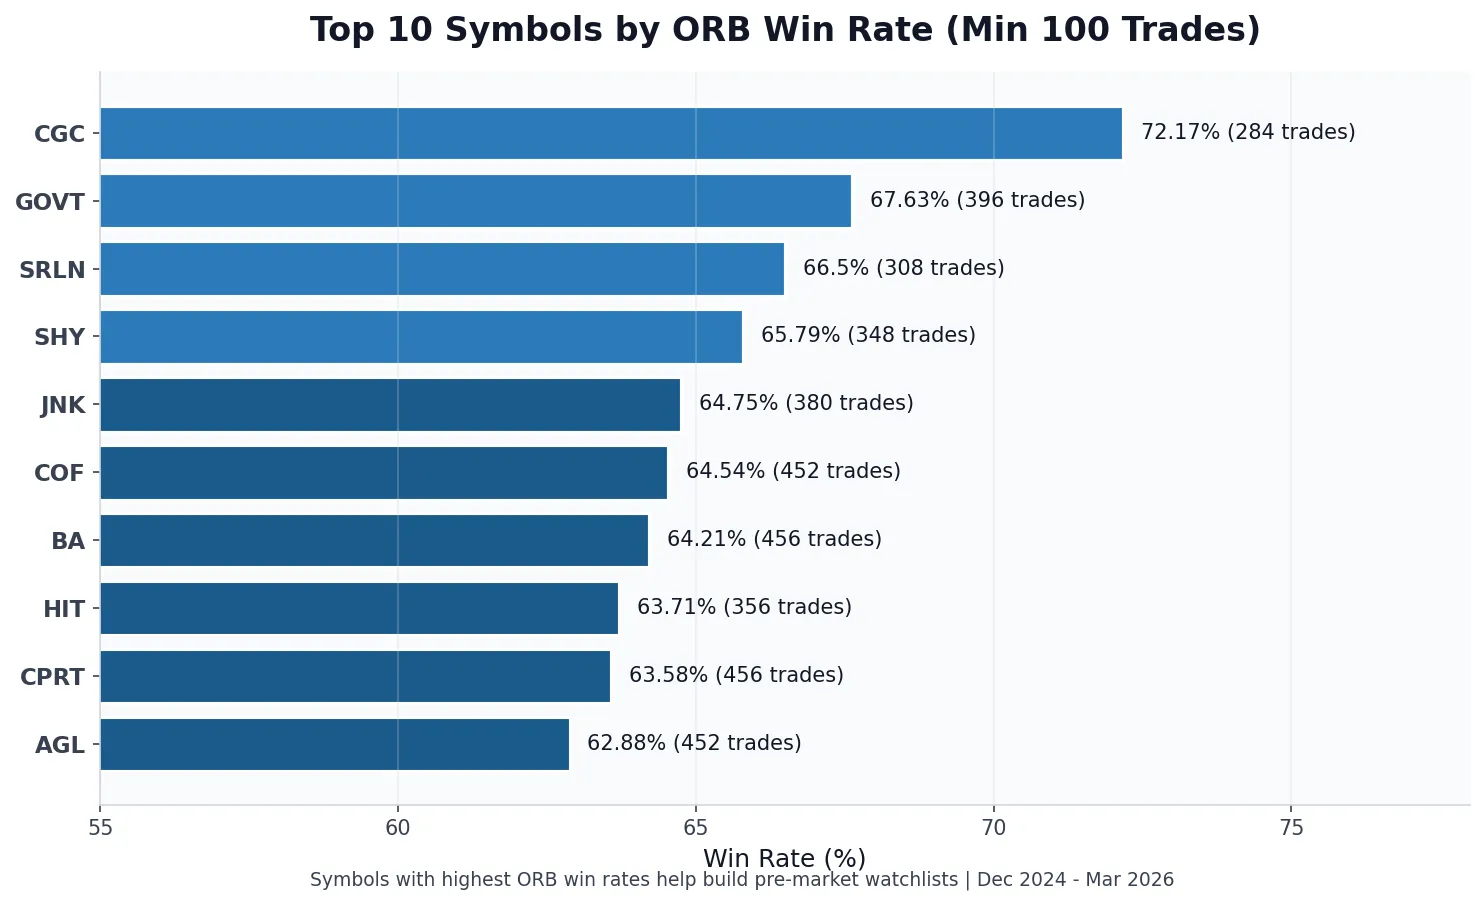
ORB Setups provides backtesting across 150,000+ historical trades with 2 years of 1-minute candle data. Before adding a stock to your watchlist, check its historical ORB performance. A stock with a 45% win rate on 5-minute ORB setups versus one with 62% win rate represents a meaningful edge difference.
We prioritize stocks showing positive expectancy in our backtester. Expectancy combines win rate with average win size versus average loss size. A stock with a lower win rate but larger average winners may still be worth trading. The numbers guide the decision before emotional attachment forms.
Pre-Market Red Flags to Avoid
Some pre-market conditions signal lower-probability ORB setups. Identifying these red flags prevents wasting capital on marginal trades.
Fading Pre-Market Volume
A stock that spikes pre-market volume at 4:00 AM but shows declining volume approaching 9:30 AM often produces choppy opening ranges. The early interest dried up. Wait for stocks maintaining volume momentum into the open.
Wide Pre-Market Spreads
Bid-ask spreads exceeding 0.5% of stock price indicate thin liquidity. Even high-volume names can have wide spreads pre-market. Wide spreads mean worse fills on entries and exits, eroding edge.
Multiple Failed Breakout Attempts Pre-Market
Stocks that attempt to break pre-market highs multiple times without follow-through often continue that pattern in the regular session. Look for clean pre-market price action with clear range boundaries.
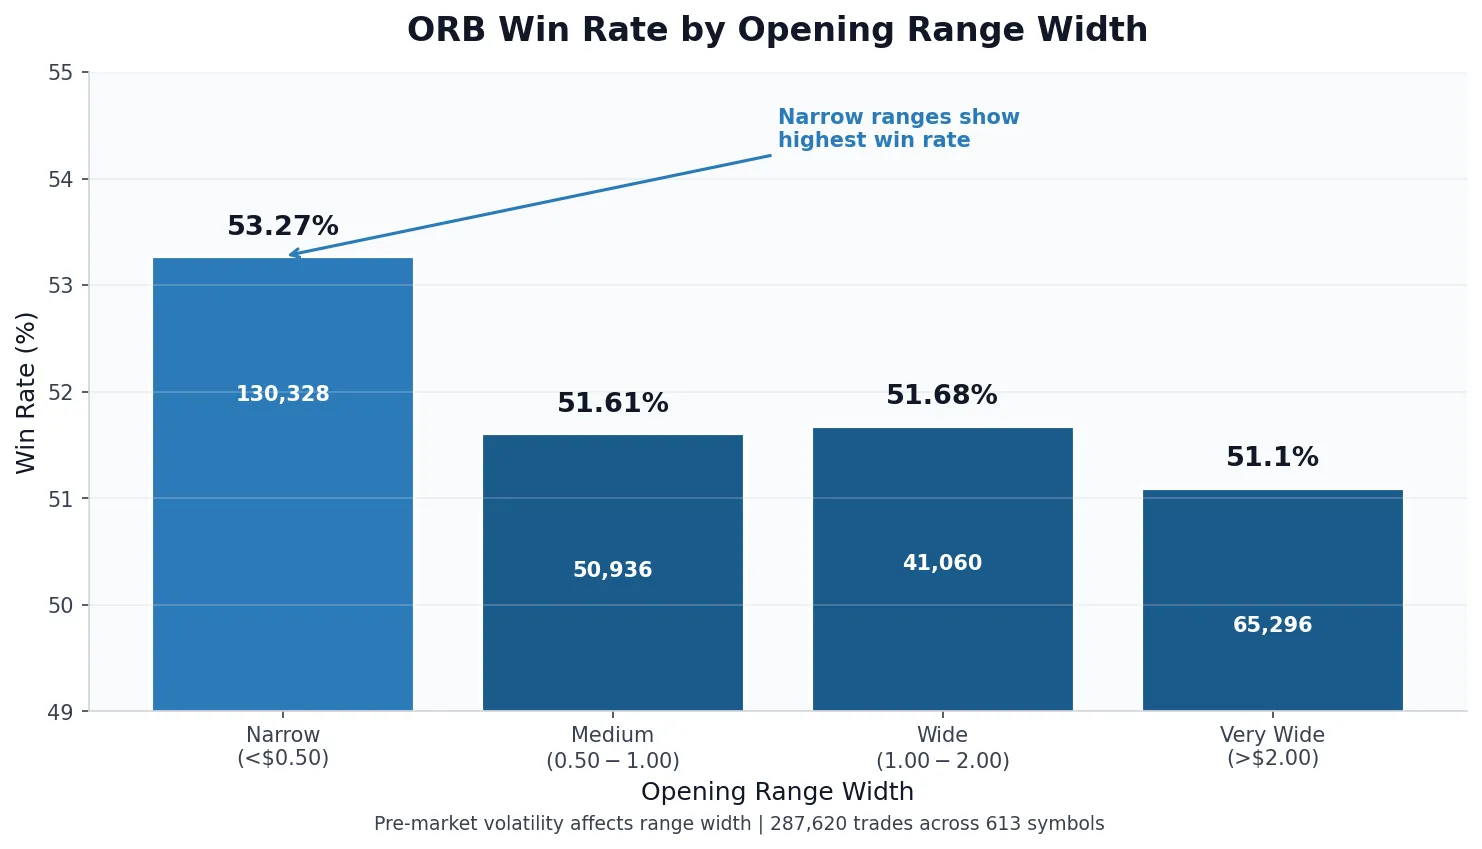
Overextended Gaps
Gaps exceeding 10% to 15% from prior close carry increased gap-fill risk. The opening range may form at extended levels with limited upside continuation. These setups require adjusted expectations and tighter stop placement.
Integrating Pre-Market Analysis with ORB Strategy
Pre-market analysis sets up the trade plan. Once the opening bell rings, execution follows the opening range breakout rules: identify the range, wait for the breakout, enter with defined risk.
Your pre-market work determines which stocks get trading capital. A stock meeting all pre-market criteria receives your standard position size. Borderline setups get reduced size or pass entirely. This position-sizing discipline stems from pre-market preparation.
We use the ORB scanner to monitor all watchlist stocks simultaneously once the market opens. The scanner refreshes every 2 seconds, detecting breakouts across 595+ symbols. Pre-market analysis narrows focus; the scanner catches the exact breakout moment.
Frequently Asked Questions
What time should I start pre-market analysis for ORB trading?
Pre-market analysis for ORB trading should begin at 7:00 AM Eastern to allow sufficient time for gap scanning, news review, and technical analysis before the 9:30 AM market open. Starting earlier captures overnight developments, while the final hour before open confirms volume and refines the watchlist.
How many stocks should be on my ORB watchlist?
An effective ORB watchlist contains 5 to 10 stocks. More than 10 spreads attention too thin during the fast-moving opening range period. Pre-market analysis filters hundreds of gap candidates down to only the highest-probability setups.
What pre-market volume level indicates a good ORB setup?
Stocks showing pre-market volume of at least 100,000 shares and relative volume 2x or higher compared to average are considered strong ORB candidates. This level of pre-market activity suggests institutional positioning and typically produces cleaner breakout momentum.
How does gap size affect opening range breakout performance?
Gap size affects ORB performance significantly. Gaps between 1% and 3% historically produce the most reliable opening range breakouts. Gaps under 1% may lack momentum, while gaps exceeding 10% carry increased gap-fill risk. Gap direction should align with overall market and sector trend.
Should I trade ORB setups on earnings gap stocks?
Earnings gap ORB setups can produce extended moves but carry increased reversal risk. These setups require separate categorization and tighter risk management. We recommend reduced position sizes on post-earnings ORB trades until you backtest your specific strategy on earnings gaps.
How do I use historical win rates to filter ORB setups?
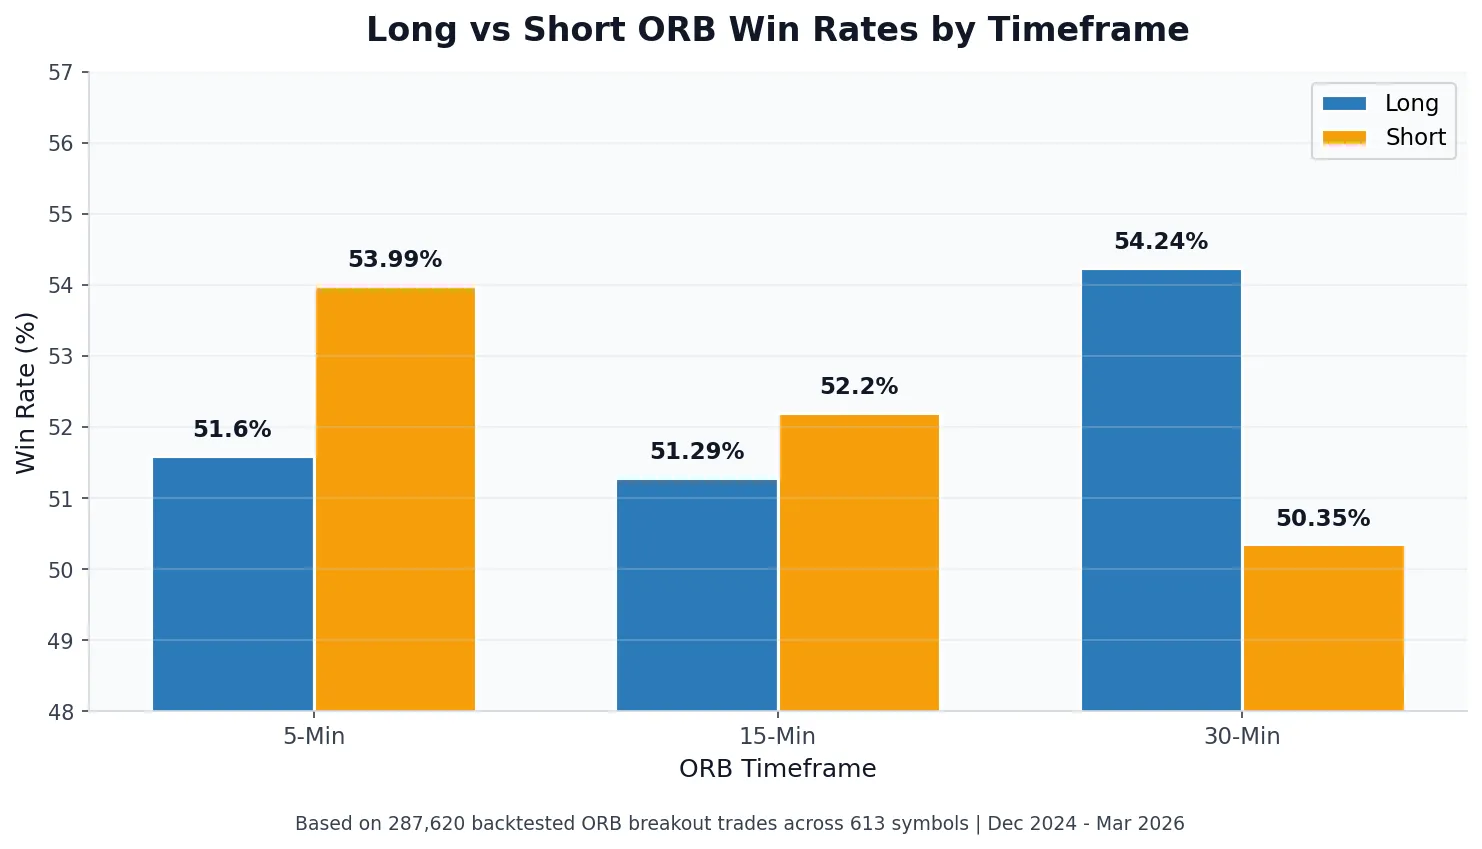
Historical ORB win rates help filter setup quality before trading. Check each watchlist stock’s backtested performance across 5-minute, 15-minute, and 30-minute opening ranges. Prioritize stocks with positive expectancy (win rate multiplied by average win versus loss rate multiplied by average loss).
What are the main red flags to avoid in pre-market analysis?
Key red flags in pre-market analysis include: fading pre-market volume as market open approaches, bid-ask spreads exceeding 0.5% of stock price, multiple failed breakout attempts pre-market, and gaps exceeding 10% to 15% from prior close. These conditions signal lower-probability ORB setups.
Conclusion: Pre-Market Preparation Creates ORB Edge
Pre-market analysis transforms opening range breakout trading from reactive to systematic. The work done before 9:30 AM determines which stocks receive your capital and attention during the session’s most volatile period.
Build a consistent pre-market routine. Scan for gaps, filter by volume, review news catalysts, check technical levels, and confirm with backtested data. This process narrows hundreds of possibilities to the handful of setups with genuine edge.
The ORB Setups scanner and backtester accelerate this workflow. Scan 595+ stocks in real-time, check historical win rates before entering, and receive trade cards with calculated entries, targets, and stops. See the data before you risk a dollar.
Related Research
How VIX Affects Opening Range Breakout Win Rates: A Backtested Analysis
VIX 16-24 produces 58% ORB win rates vs 48% when VIX is below 13. Backtest of 47,000 opening range breakout…
Apr 21, 2026Opening Range Breakout Win Rate: What 150,000+ Trades Reveal About ORB Strategy Performance
ORB win rates range from 48% to 68% based on timeframe. Our analysis of 150,000+ trades reveals which setups have…
Apr 19, 2026Gap and Go Trading Strategy: How to Combine Gap Plays with Opening Range Breakouts
Gap and go setups combine pre-market gaps with opening range breakouts. Learn entry rules, stop placement, and backtested win rates…
Apr 18, 2026Trade with data.
Not hope.
600+ symbols. 2-second refresh. 150,000+ backtested setups. Win rates on every trade.
Start Your Edge