Opening Range Width: The U-Curve Hiding in 105,000 ORB Trades
We bucketed 105,000 15-minute opening range breakout trades by range width. Tight ranges won most often, ranges over 4% of price paid ten times the average, and the 1-2% middle was the dead zone.
FAIL: error: no such post
Published July 22, 2026
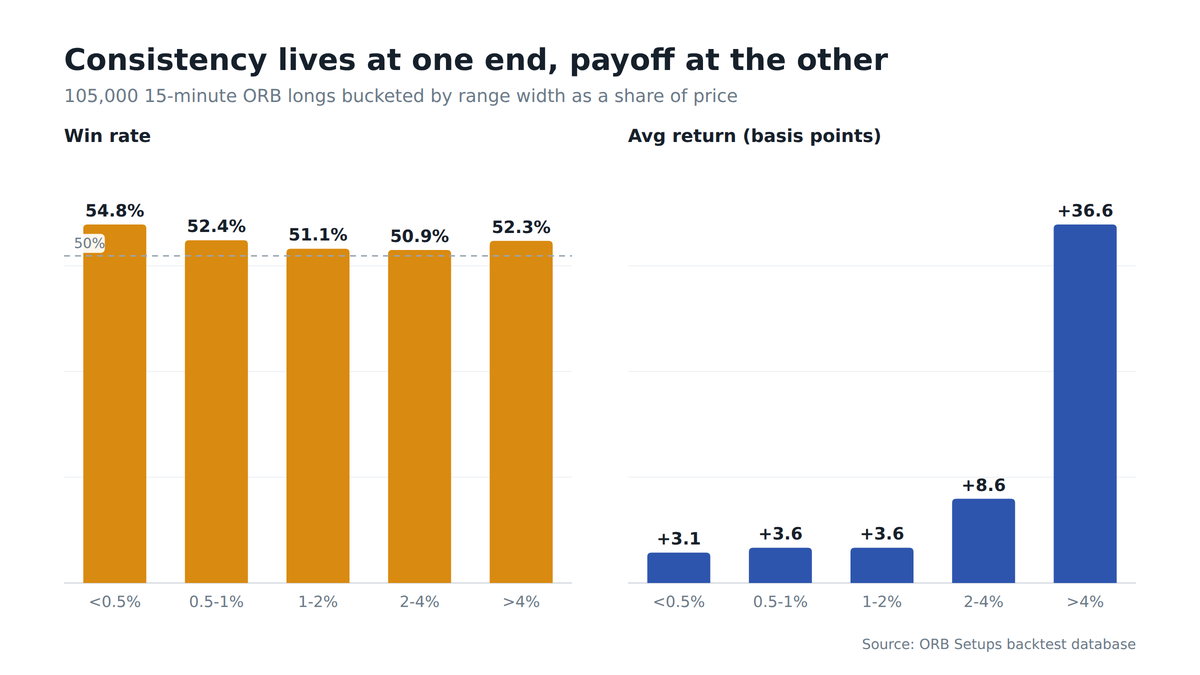
Before the breakout even happens, the opening range itself is telling you what kind of trade you are about to take. We bucketed 105,000 15-minute ORB long trades by the width of the range relative to the stock’s price, and the result is not a straight line: it is a U-curve.
The tightest ranges win most often. The widest ranges pay by far the most. And the middle of the distribution is where expectancy goes to die.
The U-curve
Standard configuration: long break of the 15-minute range, full-range target and stop, two years, all liquid symbols. Returns are in basis points of the entry price so that a $600 stock and a $6 stock can share a table.
| Opening range width | Trades | Win rate | Avg return (bps) |
|---|---|---|---|
| Under 0.5% of price | 10,693 | 54.8% | +3.1 |
| 0.5% to 1% | 29,905 | 52.4% | +3.6 |
| 1% to 2% | 37,500 | 51.1% | +3.6 |
| 2% to 4% | 21,048 | 50.9% | +8.6 |
| Over 4% of price | 6,052 | 52.3% | +36.6 |
Three things jump out of that table:
- Tight ranges win most often: 54.8% for ranges under 0.5% of price, the best hit rate in the study.
- Wide ranges pay the most: +36.6 basis points on average for ranges over 4% of price.
- The middle lags on both counts: the 1% to 2% bucket wins just 51.1% of the time for +3.6 basis points.
Two different edges at the two ends
The tight end: a consistency edge
A range under half a percent of price means a quiet, orderly open. The break of that kind of range resolved in the trader’s favor 54.8% of the time, well above the baseline ORB win rate.
The catch is the prize. With the target set at one range width, winning a tight-range trade pays a tight-range reward: about 3 basis points on average.
The wide end: a payoff edge
Ranges over 4% of price come from gap days, earnings reactions, and news opens. They won a little over half the time, but the average result was ten times the middle of the table, because the range that sets your target is enormous.
One caution belongs here. A 4% range implies a 4% stop under full-range rules, so these trades demand proportionally smaller size, and the position-sizing math matters more than anywhere else in the study.
The dead zone in the middle
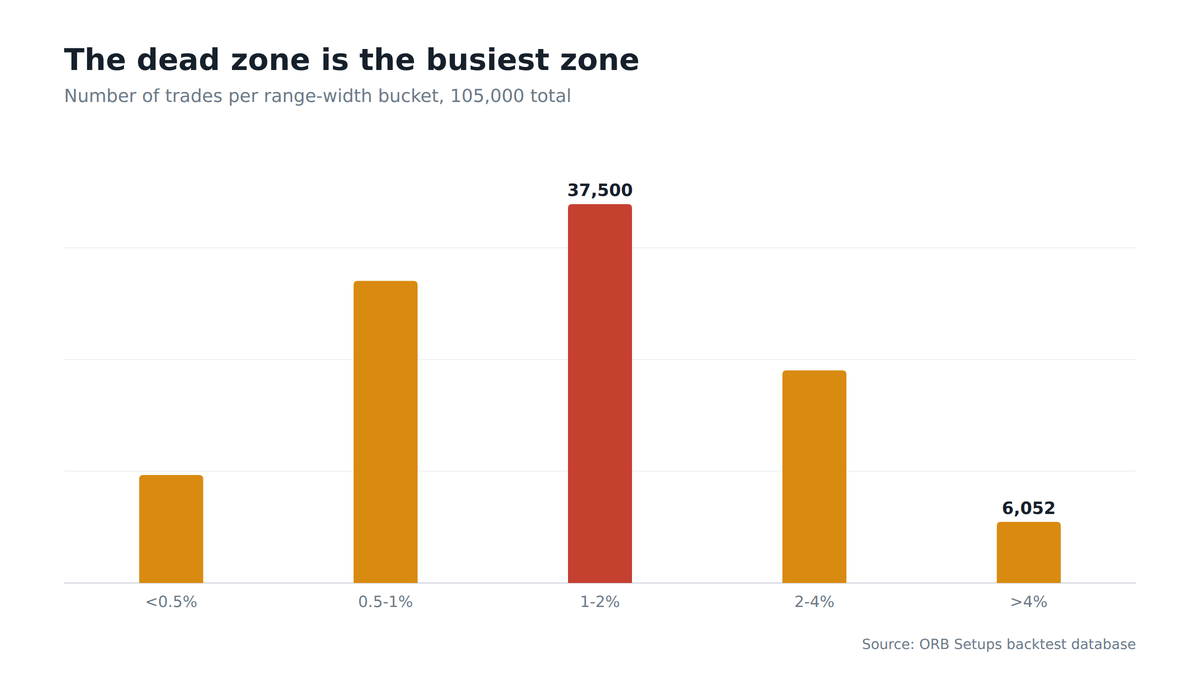
The 1% to 2% bucket is the largest group in the study, and the weakest: a 51.1% win rate at 3.6 basis points.
A medium range is wide enough that the stop hurts and the market has already moved, but not wide enough to signal a genuinely unusual day. It is the no-man’s-land between a quiet open and an event open.
And it is where more ORB trades happen than anywhere else. If you take every breakout mechanically, this bucket is quietly diluting your results, and it is the first place to point a filter.
Using the width before the break
Unlike most trade statistics, range width is known before you ever enter. By 9:45 the range is set and the measurement takes one division.
The data suggests a simple triage:
- Tight range: favor taking the break, expect modest pay per trade, and let frequency compound it.
- Very wide range: treat it as an event trade, size down for the wider stop, and respect that the payoff distribution, not the hit rate, is what carries it.
- Middle range: demand more confirmation, because the base rate alone barely clears a coin flip. This is where filtering out false breakouts earns its keep.
The fine print
- Backtested fills: these are simulated entries without slippage across a whole universe of liquid symbols.
- Smallest sample at the wide end: the over-4% bucket holds 6,052 trades, the fewest in the table.
- Your symbol gets the final vote: your instrument’s own numbers live on its per-symbol statistics page and should settle any close call.
Keep reading
Frequently asked questions
Do tight opening ranges have a higher ORB win rate than wide ones?
Ranges under 0.5% of price won 54.8% of the time, the best hit rate in a study of 105,000 15-minute ORB long trades. Wider ranges won a little over half the time, so the tight end holds the win-rate edge. The tradeoff is that tight-range winners pay only about 3 basis points each.
Which opening range width produces the biggest average return per trade?
Ranges over 4% of price averaged +36.6 basis points per trade, about ten times the middle of the distribution. Those wide ranges came from gap days, earnings reactions, and news opens, where the full-range target is enormous. They won just 52.3% of the time, so the payoff, not the hit rate, carries them.
Why do medium-width opening ranges perform worst?
The 1% to 2% bucket won just 51.1% of the time for +3.6 basis points, barely above a coin flip. It is wide enough that the stop hurts and the market has already moved, but not wide enough to signal an unusual day. It sits in the no-man’s-land between a quiet open and an event open.
How many ORB trades fall into each range-width bucket?
The 1% to 2% bucket is the largest at 37,500 trades, followed by 29,905 in the 0.5% to 1% band and 21,048 in the 2% to 4% band. The tight sub-0.5% group holds 10,693 trades, and the over-4% tail is smallest at 6,052. The weakest bucket is also the most crowded.
Can you know the opening range width before entering an ORB trade?
Yes, the range is set by 9:45 for a 15-minute opening range, and measuring its width relative to price takes one division. That makes width one of the few trade statistics known before entry. It lets you triage a breakout as tight, medium, or very wide before committing.
Should wide opening ranges be traded with smaller position size?
Yes, a 4% range implies a 4% stop under full-range rules, so ranges over 4% of price demand proportionally smaller size. Those trades averaged +36.6 basis points, but the wider stop means position-sizing math matters more here than anywhere else in the study. Treat them as event trades and size down.
Frequently Asked Questions
Related Research
What Is the Right ORB Target? Five Rules Tested on 100,569 Identical Entries
We ran the same 100,569 opening range breakout entries through five target rules. The half-range target won 66% but earned…
Aug 26, 2026The Most Consistent ORB Stocks: A Two-Year Leaderboard
The strongest 15-minute opening range breakout performers of the last two years: twelve symbols that won 60% or better across…
Aug 14, 2026The Best Day of the Week for ORB Trades: 207,000 Backtests by Weekday
We split 207,000 15-minute opening range breakout trades by weekday and direction. Monday favored longs, Wednesday quietly flipped to shorts,…
Aug 5, 2026Trade with data.
Not hope.
640+ stocks and ETFs, updated every 2 minutes during market hours. Every setup shows its 90-day win rate.
Start Your Edge