Opening Range Breakout Win Rate: What 150,000+ Trades Reveal About ORB Strategy Performance
Across 190,000+ ORB trades on 611 stocks and ETFs, 15-minute opening range win rates average 52.2% to 52.9% by timeframe, and top symbols clear 88%. Why win rate alone misleads, and how expectancy fixes it.
Published: March 29, 2026 | Last Updated: April 1, 2026
Opening range breakout win rate varies significantly based on timeframe, market conditions, and symbol selection.
Our analysis of 190,000+ ORB trades across 611 stocks and ETFs reveals that average per-symbol win rates range from 52.2% to 52.9% depending on the timeframe. Top-performing symbols with sufficient sample sizes achieve win rates above 88%.
Key takeaways
- Average per-symbol ORB win rates range from 52.2% to 52.9% depending on the timeframe.
- Win rate alone does not determine profitability. You must pair it with reward-to-risk to calculate expectancy.
- The 30-minute ORB shows the highest average win rate at 52.9%, while the 5-minute ORB shows the highest average expectancy at 0.028R.
- Long setups have beaten shorts by 4.5 percentage points (37.4% vs. 32.9% realized win rate).
This article breaks down the real numbers behind ORB strategy performance. We cover which timeframes work best, which symbols consistently outperform, and how to filter for high-probability setups using backtested data.
What Is Opening Range Breakout Win Rate?
Opening range breakout win rate measures the percentage of ORB trades that reach their profit target before hitting the stop loss. A 55% win rate means that out of 100 trades, 55 reached the target and 45 stopped out.
Win rate alone does not determine profitability. You must consider the reward-to-risk ratio alongside win rate to calculate trade expectancy.
Key insight: A 45% win rate with a 2:1 reward-to-risk can outperform a 60% win rate with a 0.8:1 ratio.
Our ORB Backtester calculates win rate, average P/L, and trade expectancy for every symbol and timeframe combination. This allows you to see exactly which setups have positive expectancy before you risk capital.
| Win rate | Reward-to-risk | Expectancy |
|---|---|---|
| 45% | 2 : 1 | +0.35R |
| 55% | 1.5 : 1 | +0.375R |
| 60% | 1 : 1 | +0.20R |
| 70% | 0.5 : 1 | +0.05R |
A 45% win rate at 2:1 reward-to-risk (+0.35R) beats a 70% win rate at 0.5:1 (+0.05R). Win rate alone does not determine profitability.
Historical Win Rates by Opening Range Timeframe
Opening range timeframe selection directly impacts win rate. Our backtest data across 190,000+ trades shows distinct performance patterns for 5-minute, 15-minute, and 30-minute opening ranges.
If you want the head-to-head numbers in isolation, our study on which opening range timeframe has the best win rate compares all three side by side.
5-Minute Opening Range Win Rates
The 5-minute opening range produces the highest number of setups per day but also the lowest average win rate. Across 6,054 symbol-level stat records covering 591 unique symbols, 5-minute ORB trades show an average win rate of 52.2% with an average expectancy of 0.028R per trade.
Shorter ranges capture more noise from the opening auction. Price frequently breaks above or below the 5-minute high or low, only to reverse within minutes. This results in more false breakouts and lower win rates compared to wider ranges.
Traders using the 5-minute ORB often require additional confirmation filters. Volume expansion, relative strength, and gap direction can improve win rates when applied consistently.
15-Minute Opening Range Win Rates
The 15-minute opening range represents a balance between setup frequency and win rate. Across 6,748 symbol-level stat records covering 605 unique symbols, 15-minute ORB trades achieve an average win rate of 52.5% with an average expectancy of 0.004R per trade.
This timeframe filters out much of the opening volatility while still providing actionable setups before 10:00 AM ET. Many professional traders prefer the 15-minute range because it offers sufficient price discovery without waiting too long into the session.
The 15-minute ORB shows a slightly higher average win rate than the 5-minute range. Its lower average expectancy (0.004R vs. 0.028R) highlights how win rate alone does not determine profitability. Symbol selection and reward-to-risk parameters play a critical role.
30-Minute Opening Range Win Rates
The 30-minute opening range shows the highest average win rates in our backtest data. Across 6,982 symbol-level stat records covering 608 unique symbols, the 30-minute ORB achieves an average win rate of 52.9% with an average expectancy of 0.019R per trade.
Wider ranges reduce false breakouts but also limit the number of setups per day. By 10:00 AM ET, the opening range is established and breakout signals are generated. This leaves less time in the morning session for trades to develop.
The 30-minute ORB works best for traders who prefer fewer, higher-quality setups. The trade-off is missing early morning momentum that the 5-minute and 15-minute ranges capture.
| Opening range | Avg win rate | Avg expectancy | Symbols |
|---|---|---|---|
| 5-minute | 52.2% | +0.028R | 591 |
| 15-minute | 52.5% | +0.004R | 605 |
| 30-minute | 52.9% | +0.019R | 608 |
The 30-minute range shows the highest average win rate at 52.9%, but the 5-minute range shows the highest expectancy at 0.028R. Win rate and expectancy do not move together.
Win Rates by Symbol Type
Not all symbols respond equally to opening range breakout strategies. Our analysis of 611 stocks and ETFs reveals significant win rate variation based on security type, volatility profile, and average daily volume.
ETF Win Rates vs. Individual Stocks
ETFs like SPY, QQQ, and IWM tend to show more consistent ORB win rates than individual stocks. Diversified ETFs smooth out single-stock noise, which reduces the variance in breakout outcomes across different market conditions.
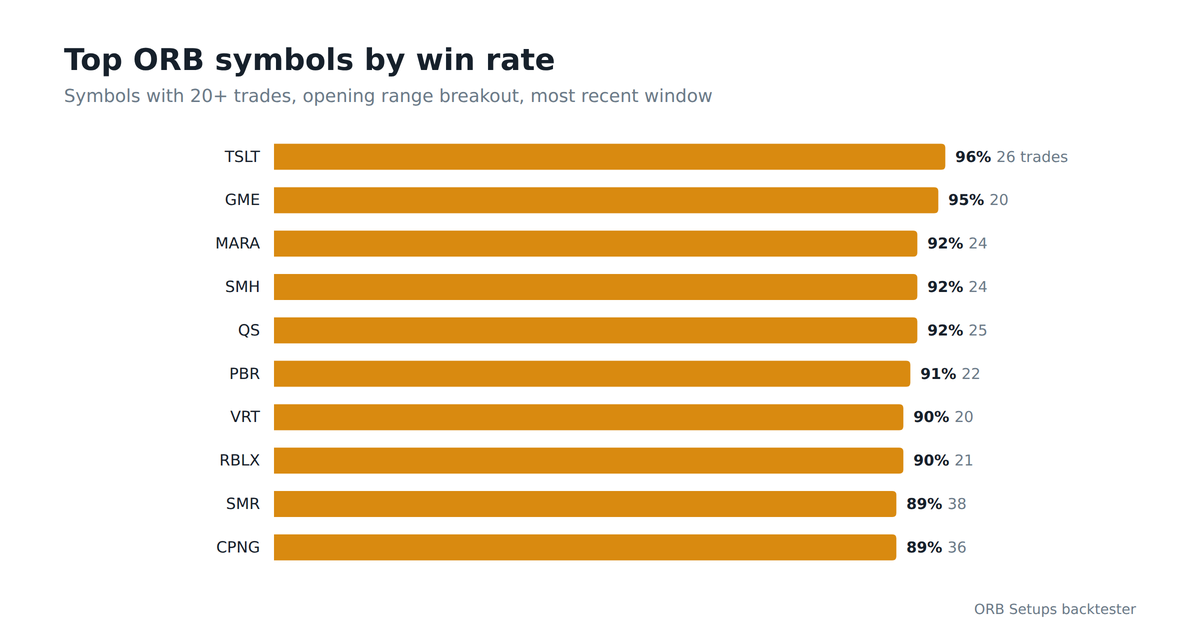
Individual stocks show wider win rate dispersion. Our top-performing symbols include names like TSLT (96% win rate over 26 trades), GME (95% over 20 trades), and MARA (92% over 24 trades).
These high win rates require minimum trade thresholds to be meaningful. Individual stock performance can also shift as market conditions change.
If you are building a systematic ORB strategy, starting with major ETFs provides more stable baseline performance metrics.
Top Performing ORB Symbols
Among symbols with at least 20 trades in our dataset, the top performers by win rate include:
- TSLT: 96% win rate (26 trades, 0.066R expectancy)
- GME: 95% win rate (20 trades, 0.055R expectancy)
- MARA: 92% win rate (24 trades, 0.028R expectancy)
- SMH: 92% win rate (24 trades, 0.655R expectancy)
- QS: 92% win rate (25 trades, 0.027R expectancy)
- PBR: 91% win rate (22 trades, 0.054R expectancy)
- VRT: 90% win rate (20 trades, 0.765R expectancy)
- RBLX: 90% win rate (21 trades, 0.310R expectancy)
- SMR: 89% win rate (38 trades, 0.065R expectancy)
- CPNG: 89% win rate (36 trades, 0.051R expectancy)
Note that higher win rates do not always correspond to higher expectancy. SMH and VRT show the highest expectancy values despite not having the highest win rates, illustrating why both metrics matter.
Because short samples can flatter a single ticker, our leaderboard of the most consistent ORB stocks ranks names by how reliably they repeat over a two-year window.
Volatility Impact on Win Rate
Symbol volatility, measured by ATR as a percentage of price, correlates with ORB win rate patterns. Higher ATR stocks show more follow-through after breakouts, but also larger adverse excursions before reaching targets.
Our SPY ORB width data over the past 90 days shows that wide opening ranges (averaging $3.30) occurred on 51 out of 78 trading days, medium ranges (averaging $1.57) on 26 days, and tight ranges on just 1 day.
The prevalence of wide ranges reflects elevated recent volatility, which influences breakout dynamics across all symbols. Our analysis of how opening range width affects results reveals a U-curve hiding in the data.
The ORB Scanner displays ATR data for every setup, allowing you to filter for symbols within your preferred volatility range.
How to Improve Your ORB Win Rate
Raw ORB win rates represent baseline performance without filters. Adding systematic filters based on backtested criteria can increase win rates while maintaining sufficient setup frequency.
Gap Direction Filter
Trading breakouts in the direction of the overnight gap tends to improve win rate. If a stock gaps up, taking only long breakouts above the opening range high shows better performance than taking both long and short setups.
Our 30-day data confirms a directional bias. Long ORB setups achieved a 37.4% realized win rate across 93,202 trades, compared to 32.9% for short setups across 97,258 trades.
Key insight: This 4.5 percentage point edge for longs suggests that aligning with buying pressure improves outcomes.
Our full study on long versus short ORB direction tests this across 598,000 trades.
Gap direction aligns your trade with overnight order flow. Institutions that accumulated positions after hours are more likely to defend breakouts in the gap direction than fight against their positioning.
Volume Confirmation
Requiring breakout volume to exceed average volume confirms institutional participation in the breakout. Low-volume breakouts frequently reverse as there is insufficient buying or selling pressure to sustain the move.
Our backtester tracks volume at breakout for every historical setup. You can filter specifically for high-volume breakouts to see how this parameter affects performance for any symbol.
Market Context Filters
ORB win rates vary based on broader market conditions. During trending markets, win rates tend to increase compared to choppy or range-bound periods. VIX level provides a useful proxy for market regime.
When VIX is low and markets are trending, ORB strategies on SPY and QQQ tend to show elevated win rates as trends persist. When volatility spikes, win rates typically decline as reversals and whipsaws become more common.
Our research on how VIX affects ORB win rates explores this relationship in detail with specific backtest data.
Calculating Expected Value from Win Rate
Win rate becomes meaningful when combined with reward-to-risk ratio to calculate trade expectancy. Expectancy tells you how much you can expect to make per dollar risked over a large sample of trades.
The Expectancy Formula
Trade expectancy equals (Win Rate x Average Win) minus (Loss Rate x Average Loss). For an ORB strategy with 55% win rate, 1.5R average win, and 1R average loss, expectancy equals (0.55 x 1.5) minus (0.45 x 1) = 0.825 minus 0.45 = 0.375R.
This means for every dollar you risk, you expect to make $0.375 over time. Positive expectancy is required for profitability.
Watch out: Even a 70% win rate produces negative expectancy if average wins are smaller than average losses.
Our real data illustrates this clearly. The 5-minute ORB has a lower average win rate (52.2%) than the 30-minute ORB (52.9%), yet the 5-minute ORB shows higher average expectancy (0.028R vs. 0.019R). Win rate and expectancy do not always move together.
Sample Size Requirements
Reliable win rate estimates require sufficient sample size. A strategy that shows 60% win rate over 20 trades has high variance. The same strategy measured over 500 trades provides a statistically meaningful baseline.
Our backtest database contains 190,000+ ORB trades across 611 symbols. This sample size allows you to see win rate patterns with statistical confidence rather than relying on small samples that may reflect luck rather than edge.
Common Win Rate Misconceptions
Many traders misunderstand how win rate relates to profitability. Clearing up these misconceptions helps you evaluate ORB strategies more accurately.
Higher Win Rate Is Not Always Better
A 40% win rate strategy can outperform a 70% win rate strategy. What matters is expectancy. If your 40% winner averages 3R and your losers average 1R, expectancy is (0.40 x 3) minus (0.60 x 1) = 1.2 minus 0.6 = 0.6R. This beats many high win rate strategies.
ORB strategies with wider targets and tighter stops often show lower win rates but higher expectancy. Do not dismiss a strategy because win rate appears low.
Per-Symbol Win Rate vs. Realized Win Rate
There is an important distinction between average per-symbol win rate and aggregate realized win rate. Our data shows the average per-symbol win rate across all ORB timeframes is approximately 52% to 53%.
However, the aggregate realized win rate across all 190,460 trades over the most recent 30-day period is 35.1% (66,868 targets hit out of 190,460 total trades).
This difference occurs because symbols with more trades (and often lower win rates) contribute more to the aggregate number. When evaluating a strategy, consider both metrics: per-symbol averages tell you what a typical symbol does, while the realized rate tells you what your actual portfolio would experience.
Win Rate Changes Over Time
Market conditions affect win rate performance. A strategy that showed strong win rates in one period may underperform in another if the market regime changes. Backtesting across multiple market environments reveals how stable your win rate is likely to be.
Our backtester includes data from both trending and choppy market periods. This shows how ORB win rates perform across different conditions rather than just during favorable periods.
Win Rate Varies by Setup Quality
Not all ORB setups are equal. A breakout on high relative volume with gap alignment and sector support will show different win rates than a low-volume breakout against the overnight gap.
Filtering for higher-quality setups reduces trade frequency but increases win rate. The ORB Scanner displays multiple quality indicators for each setup, allowing you to select only the highest-probability opportunities.
Backtesting Your Own Win Rate Parameters
Published win rate statistics provide a baseline, but your personal results depend on your specific parameters. Entry timing, stop placement, target selection, and symbol universe all affect individual win rate outcomes.
Key Parameters to Test
Start by testing different stop loss placements. Stops at the opposite side of the opening range show different win rates than ATR-based stops or fixed percentage stops. ATR-based stops tend to produce more consistent results because they adapt to each symbol’s volatility, a topic we cover in ATR-based position sizing.
Target placement affects win rate directly. Tighter targets (1R or 1.5R) show higher win rates but lower expectancy. Wider targets (2R or 3R) show lower win rates but can produce better overall returns when winners are significantly larger than losers.
Our tested rules on choosing the right ORB target compare five approaches on more than 100,000 identical entries.
Using the ORB Backtester
The ORB Backtester allows you to test win rates across any symbol, timeframe, and filter combination. Select your parameters, and see historical win rate, average P/L, and trade expectancy calculated from 1-minute candle data.
This removes guesswork from strategy development. Instead of trading a strategy for months to understand its win rate, you can validate parameters against 190,000+ historical trades in seconds.
Win Rate Benchmarks for ORB Traders
Based on our backtest data across 611 symbols and 190,000+ trades, here are realistic win rate benchmarks for ORB strategies. These numbers represent average per-symbol win rates and assume proper position sizing and stop discipline.
5-Minute ORB: 52.2% average per-symbol win rate across 591 symbols. Average expectancy of 0.028R per trade.
15-Minute ORB: 52.5% average per-symbol win rate across 605 symbols. Average expectancy of 0.004R per trade.
30-Minute ORB: 52.9% average per-symbol win rate across 608 symbols. Average expectancy of 0.019R per trade.
Individual symbol win rates vary widely. The top-performing symbols with at least 20 trades achieve win rates between 88% and 96%, while others fall well below the average.
Symbol selection is one of the most significant factors in ORB strategy performance. Long setups have also shown a meaningful edge over shorts in recent data (37.4% vs. 32.9% realized win rate).
Frequently asked questions
What is a good win rate for opening range breakout trading?
The average per-symbol ORB win rate in our database ranges from 52.2% to 52.9% depending on timeframe. Win rate alone does not determine profitability, so pair it with a favorable reward-to-risk ratio. Top-performing symbols with at least 20 trades reach win rates above 90%.
Which opening range timeframe has the highest win rate?
The 30-minute opening range shows the highest average per-symbol win rate at 52.9% across 608 symbols. The 15-minute ORB averages 52.5% and the 5-minute ORB averages 52.2%. Wider ranges filter out more false breakouts, though they also produce fewer setups per day.
Do long or short ORB breakouts have a higher win rate?
Long ORB setups achieved a 37.4% realized win rate across 93,202 trades, compared to 32.9% for short setups across 97,258 trades. That 4.5 percentage point edge over the most recent 30-day period suggests that aligning with buying pressure improves outcomes.
Interpreting ORB Win Rate, Volatility, and Expectancy
Why is realized ORB win rate lower than the per-symbol average?
The aggregate realized win rate across all 190,460 trades over the most recent 30-day period is 35.1% (66,868 targets hit), while per-symbol averages sit near 52% to 53%. Symbols with more trades, which often carry lower win rates, weight the aggregate number downward.
Does market volatility affect opening range breakout win rates?
Yes. Our SPY ORB width data shows wide opening ranges (averaging $3.30) occurred on 51 of the past 78 trading days, indicating elevated volatility. When volatility is low and markets trend, ORB win rates tend to rise. When volatility spikes, whipsaws and reversals push win rates lower.
What is trade expectancy and how does it relate to win rate?
Expectancy equals (Win Rate x Average Win) minus (Loss Rate x Average Loss). The 5-minute ORB posts the highest average expectancy at 0.028R despite a 52.2% win rate, below the 30-minute ORB’s 52.9%. This proves win rate and expectancy do not always move together.
Start Backtesting ORB Win Rates Today
Our platform provides access to 190,000+ historical ORB setups with win rate, P/L, and expectancy calculations for every symbol and timeframe combination.
The ORB Scanner identifies setups in real-time across 640+ stocks and ETFs, refreshing every 2 minutes. The ORB Backtester lets you validate any strategy against 1-minute candle data before risking capital.
See the win rates for yourself. Test your parameters against historical data and build an ORB strategy backed by evidence rather than hope.
Related Research
What Is the Right ORB Target? Five Rules Tested on 100,569 Identical Entries
We ran the same 100,569 opening range breakout entries through five target rules. The half-range target won 66% but earned…
Aug 26, 2026Opening Range Width: The U-Curve Hiding in 105,000 ORB Trades
We bucketed 105,000 15-minute opening range breakout trades by range width. Tight ranges won most often, ranges over 4% of…
Aug 21, 2026The Most Consistent ORB Stocks: A Two-Year Leaderboard
The strongest 15-minute opening range breakout performers of the last two years: twelve symbols that won 60% or better across…
Aug 14, 2026Trade with data.
Not hope.
640+ stocks and ETFs, updated every 2 minutes during market hours. Every setup shows its 90-day win rate.
Start Your Edge