The Most Consistent ORB Stocks: A Two-Year Leaderboard
The strongest 15-minute opening range breakout performers of the last two years: twelve symbols that won 60% or better across 150-plus trades each, and why win rate alone is only half the story.
FAIL: error: no such post
Published July 22, 2026
The average 15-minute opening range breakout wins about 52% of the time across our 613-symbol universe. But nobody trades the average.
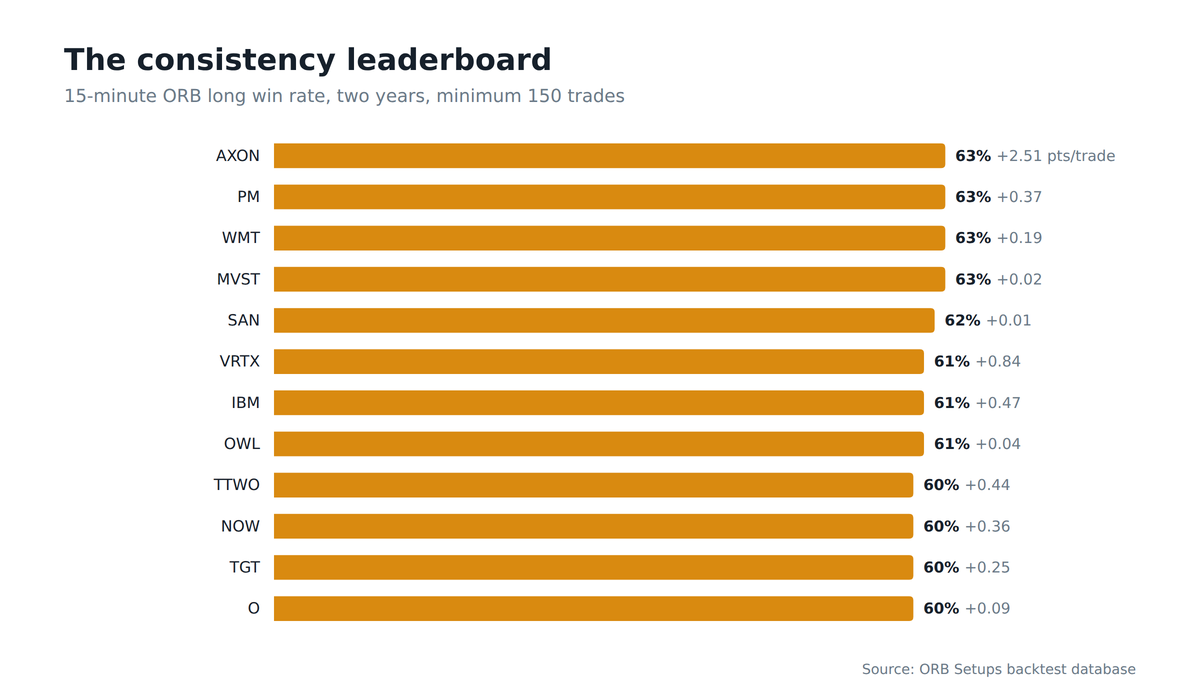
Some names respect their opening range with remarkable consistency, and concentrating on them is the single easiest upgrade to an ORB approach. Here are the strongest 15-minute ORB long performers of the last two years among symbols with at least 150 trades, from our live statistics engine.
The leaderboard
Standard configuration throughout: long entry on the break of the 15-minute opening range, full-range target, full-range stop, roughly two years of sessions.
Expectancy is in points per trade, so higher-priced symbols naturally carry larger point values. The win rate is the comparable column.
| Symbol | Trades | Win rate | Expectancy (pts) |
|---|---|---|---|
| AXON | 158 | 63% | +2.51 |
| PM | 155 | 63% | +0.37 |
| WMT | 177 | 63% | +0.19 |
| MVST | 154 | 63% | +0.02 |
| SAN | 175 | 62% | +0.01 |
| VRTX | 170 | 61% | +0.84 |
| IBM | 161 | 61% | +0.47 |
| OWL | 153 | 61% | +0.04 |
| TTWO | 167 | 60% | +0.44 |
| NOW | 156 | 60% | +0.36 |
| TGT | 157 | 60% | +0.25 |
| O | 180 | 60% | +0.09 |
Win rate is only half the column that matters
Look at AXON versus MVST. Identical 63% win rates, and one earned 125 times more per trade.
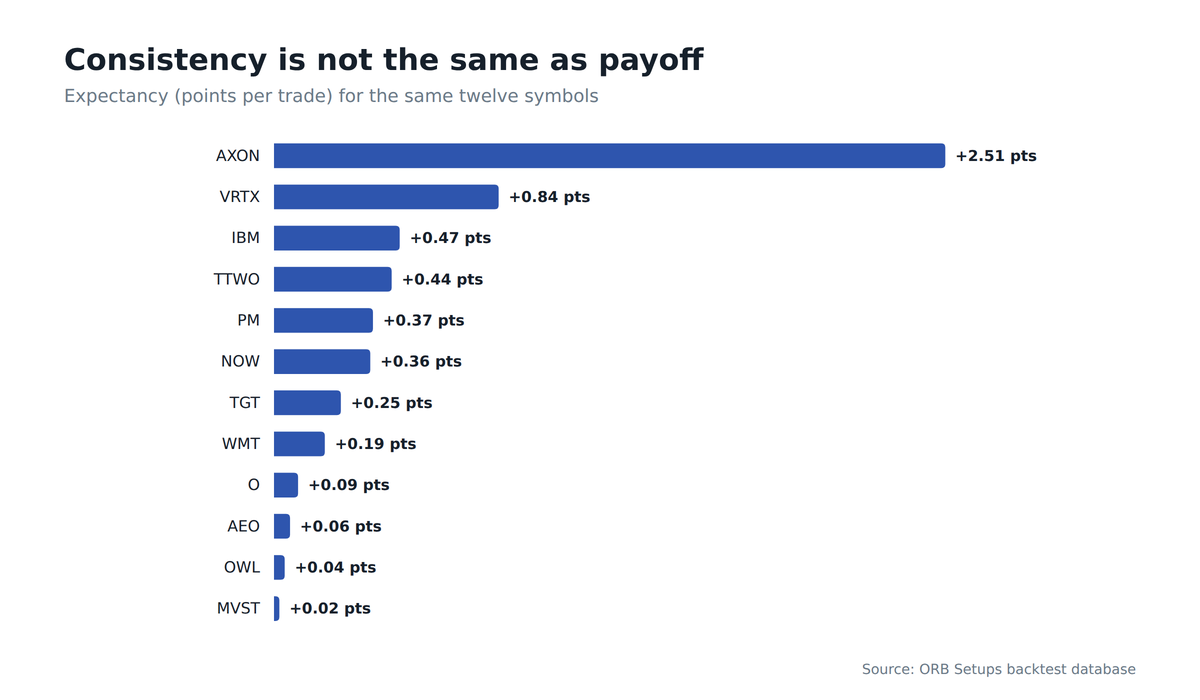
A win rate tells you how often the full-range target arrives before the full-range stop. It says nothing about how many dollars that range is worth.
High-priced, high-range names like AXON, VRTX, and NOW convert the same hit rate into vastly more expectancy than low-priced tickers, before position sizing evens the comparison.
That is why the leaderboard should be read two ways:
- The win column for consistency: how often the full-range target arrives before the stop.
- The expectancy column for payoff: how much each unit of that consistency has actually been worth in points.
What the consistent names have in common
The list is not a collection of meme tickers. It is dominated by large, liquid institutional names: a defense-tech leader, consumer staples, big-cap healthcare, enterprise software.
What sets them apart from the rest of the universe:
- Deep order books: there is enough resting liquidity that a break of the range takes real buying to produce.
- Persistent institutional flow: a decisive break of the opening range reflects real repositioning rather than a random flicker.
- One break, meant: thin, jumpy names can break their range a dozen times a morning. The names above tend to break it once and mean it.
How to use the list
Every symbol above links to its full statistics page, with both directions, all three range definitions, and the complete trade distributions. Our study of the overall ORB win rate covers what a typical symbol looks like, so you can see how far these leaders sit from the pack.
The practical workflow is the one the leaderboard implies:
- Build from documented history: start the morning watchlist with names that have a track record of respecting their range.
- Let pre-market pick among them: the day’s pre-market action decides which of those names are actually in play.
- Trade the current numbers: the stats pages update continuously, so check them rather than relying on a snapshot.
Two years and 150-plus trades per name is a meaningful sample. But these rankings drift as market character changes.
The fine print
- Backtested fills: results assume entries at the breakout level without slippage.
- Points, not percent: expectancy is in points per trade and must be squared with each symbol’s price before comparing.
- Rankings drift: a two-year leaderboard is a history, not a promise. Trade the current numbers.
Further reading
Frequently asked questions
What is the average win rate for a 15-minute opening range breakout?
The average 15-minute ORB long wins about 52% of the time across our 613-symbol universe. That figure covers a typical name with a full-range target and full-range stop. Every symbol on the consistency leaderboard clears 52% comfortably.
Which stocks have the highest ORB win rate?
Four names share the top 15-minute ORB long win rate of 63%: AXON, PM, WMT, and MVST, each with at least 150 trades over roughly two years. The next tier, SAN at 62% and VRTX and IBM at 61%, sits just behind.
Which ORB stock has the best expectancy per trade?
AXON leads with +2.51 points of expectancy per trade over 158 trades, far ahead of the rest of the leaderboard. Expectancy is measured in points, so AXON’s high price and wide range convert its 63% win rate into far larger point value than lower-priced names.
Why do two stocks with the same win rate make different profits?
AXON earned 125 times more per trade than MVST despite both posting identical 63% win rates. A win rate only tells you how often the full-range target arrives before the stop; it says nothing about how many points that range is worth. Expectancy captures the payoff.
How many trades make an ORB stock’s stats reliable?
Every symbol on this leaderboard has at least 150 trades across roughly two years of sessions. That threshold, combined with the two-year window, is a meaningful sample rather than a short snapshot, though rankings still drift as market character changes.
What kinds of stocks are most consistent for ORB trades?
All 12 leaderboard names are large, liquid institutional stocks rather than meme tickers, spanning defense-tech, consumer staples, big-cap healthcare, and enterprise software. They share deep order books and persistent institutional flow, so a break of the opening range tends to happen once and hold rather than flicker repeatedly.
Frequently Asked Questions
Related Research
What Is the Right ORB Target? Five Rules Tested on 100,569 Identical Entries
We ran the same 100,569 opening range breakout entries through five target rules. The half-range target won 66% but earned…
Aug 26, 2026Opening Range Width: The U-Curve Hiding in 105,000 ORB Trades
We bucketed 105,000 15-minute opening range breakout trades by range width. Tight ranges won most often, ranges over 4% of…
Aug 21, 2026The Best Day of the Week for ORB Trades: 207,000 Backtests by Weekday
We split 207,000 15-minute opening range breakout trades by weekday and direction. Monday favored longs, Wednesday quietly flipped to shorts,…
Aug 5, 2026Trade with data.
Not hope.
640+ stocks and ETFs, updated every 2 minutes during market hours. Every setup shows its 90-day win rate.
Start Your Edge