Gap and Go Trading Strategy: How to Combine Gap Plays with Opening Range Breakouts
Gap and go setups combine pre-market gaps with opening range breakouts. Learn entry rules, stop placement, and backtested win rates for gap trading.
Published: March 27, 2026
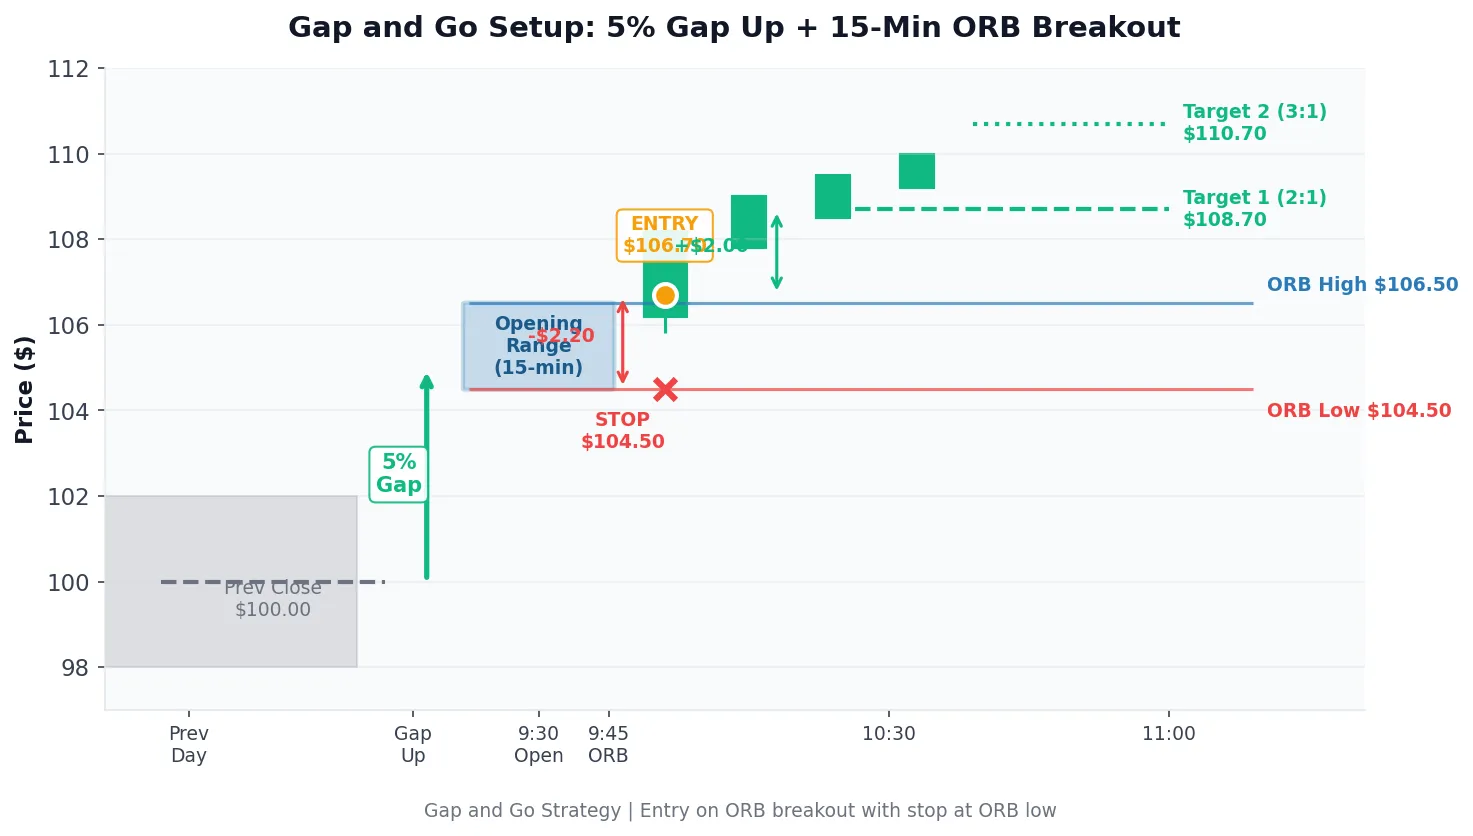
Gap and go trading combines the momentum of pre-market gaps with the confirmation power of opening range breakouts. When a stock gaps up or down significantly before the market opens, and then breaks out of its opening range in the same direction, traders get a high-probability setup with clearly defined risk parameters.
Learn more: Pre-Market Analysis for ORB Trading: How to Select…
Learn more: TTM Squeeze and Opening Range Breakout: A Combined…
Learn more: Gap and Go Trading Strategy: How to Combine Pre-Market…
The gap and go strategy works because gaps create urgency. Institutional orders that accumulate overnight drive price away from the previous close. Retail traders and algorithms then pile into the momentum once the opening range confirms direction. This confluence of participants creates the sustained moves that gap and go traders target.
What Is a Gap and Go Setup?
A gap and go setup occurs when a stock opens significantly higher or lower than its previous close, then breaks out of its opening range in the direction of the gap. The gap provides the momentum signal. The opening range breakout provides the entry trigger and risk management framework.
Gap and go setups differ from standard opening range breakouts in one key way: they require a pre-market catalyst. The gap itself represents overnight demand (for gap ups) or supply (for gap downs) that shifts the stock’s equilibrium price before retail traders can participate.
The opening range acts as a filter. Not all gaps follow through. Some gaps fade immediately as profit-takers exit overnight positions. By waiting for the opening range to break in the gap direction, traders confirm that buying or selling pressure continues into the regular session.
Gap Types That Work Best
Breakaway gaps produce the highest-probability gap and go setups. These gaps occur on news catalysts (earnings, FDA approvals, acquisitions) that change the stock’s valuation. Breakaway gaps typically show above-average pre-market volume and break through key resistance levels.
Continuation gaps (also called runaway gaps) appear mid-trend and signal that momentum remains strong. These gaps work well for gap and go trading when they occur after a consolidation period. The gap confirms that the prior trend is resuming with renewed conviction.
Exhaustion gaps should be avoided. These gaps occur at the end of extended moves and often reverse quickly. Signs of exhaustion gaps include extreme pre-market volume relative to the move size, gaps into obvious resistance zones, and gaps that occur after multiple consecutive gap days.
How to Identify High-Probability Gap and Go Setups
The gap and go strategy requires systematic screening to find setups worth trading. Not every gap qualifies. High-probability setups share specific characteristics that separate them from low-quality noise.
Pre-Market Gap Criteria
Minimum gap size matters for gap and go setups. Gaps of at least 2% filter out minor price fluctuations that lack meaningful momentum. For higher-priced stocks (above $100), a 1.5% gap may suffice. For lower-priced stocks (under $20), look for gaps of 4% or more to ensure the move has substance.
Pre-market volume confirms that the gap has participation behind it. Look for pre-market volume that reaches at least 50% of the stock’s average daily volume by 9:00 AM. Higher pre-market volume correlates with gaps that hold their gains after the open.
Catalyst identification separates news-driven gaps from random overnight fluctuations. Check for earnings releases, analyst upgrades or downgrades, FDA decisions, merger announcements, or sector-wide news. Gaps without identifiable catalysts fade more frequently.
Opening Range Confirmation Rules
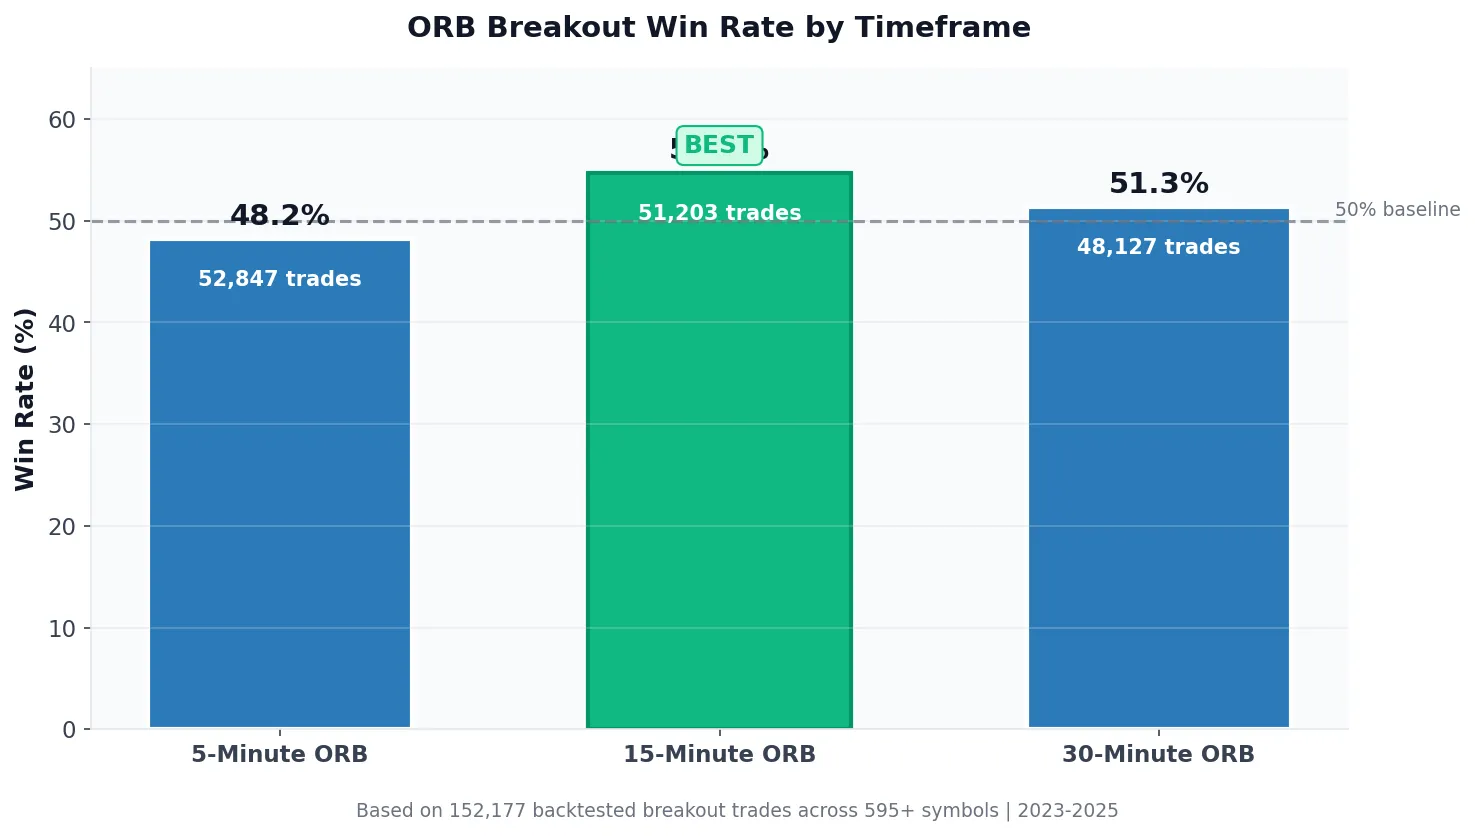
The opening range timeframe affects both win rate and reward potential. Shorter timeframes (5 minutes) generate more signals but lower win rates. Longer timeframes (30 minutes) filter out false breakouts but may miss some moves entirely.
Learn more: 5-Minute vs 15-Minute vs 30-Minute Opening Range: Which…
For gap and go setups specifically, the 15-minute opening range provides a practical balance between signal quality and timeliness. Live data across 605 symbols shows the 5-minute ORB averages a 52.2% win rate, the 15-minute ORB averages 52.5%, and the 30-minute ORB averages 52.9%. While the 30-minute timeframe edges out slightly on win rate, the 15-minute timeframe captures morning momentum earlier, which matters for gap and go setups where speed of follow-through is critical.
Breakout confirmation requires the stock to close a candle above the opening range high (for long setups) or below the opening range low (for short setups). Intrabar breakouts that reverse before the candle closes are not valid triggers.
Gap and Go Entry and Exit Rules
Systematic entry and exit rules remove emotion from gap and go trading. The opening range defines both your entry trigger and your initial stop loss, creating a complete trade plan before you enter.
Entry Triggers
For long gap and go setups, enter when price closes above the opening range high. Place your entry order slightly above the high (0.02% to 0.05% buffer) to avoid false triggers from price spikes. Limit orders work better than market orders because spreads often widen during breakouts.
Learn more: How to Identify and Avoid False Breakouts: A Data-Driven…
For short gap and go setups (gap downs), enter when price closes below the opening range low after a significant gap down. Short setups are viable but tend to underperform long setups. Over the past 30 trading days across 611 symbols, long ORB breakouts posted a 37.4% target hit rate on 93,202 trades, while short breakouts hit targets at a 32.9% rate on 97,258 trades. This directional bias makes long gap and go setups the higher-probability play in most market conditions.
Volume confirmation strengthens entries. Look for breakout candles with volume that exceeds the average volume of the opening range candles. Low-volume breakouts fail more frequently because they lack the participation needed to sustain the move.
Stop Loss Placement
The opening range provides natural stop loss levels. For long setups, place your stop below the opening range low. For short setups, place your stop above the opening range high. This approach uses the market’s own structure to define risk.
Wider opening ranges mean larger potential losses per trade. Before entering any gap and go setup, calculate your position size based on the opening range height and your maximum acceptable loss. This calculation prevents oversized positions on volatile setups.
ATR-based position sizing provides an alternative approach. Calculate the stock’s 14-period ATR and size your position so that a 1-ATR move against you equals your maximum loss. This method normalizes risk across setups with different volatility profiles.
Profit Target Strategies
Fixed risk-reward targets (2:1 or 3:1) work well for gap and go setups. If your opening range is $1 wide, target $2 to $3 of profit. This approach ensures that winners outpace losers even with a moderate win rate.
Trailing stops capture extended moves. After price moves 1x your risk in your favor, move your stop to breakeven. After 2x your risk, trail your stop by 1 ATR below price (for longs) or above price (for shorts). This method protects profits while allowing winners to run.
Time-based exits address gap and go setups that stall. If a setup has not reached its target by 11:30 AM, consider exiting at market. Morning momentum fades as the lunch hour approaches, and setups that have not worked by midday rarely improve.
Gap and Go Strategy: Backtested Performance Data
Historical performance data reveals which gap and go parameters produce the best results. Analysis of 190,460 ORB trades over the past 30 trading days across 611 symbols provides insights into optimal timeframes and directional biases.
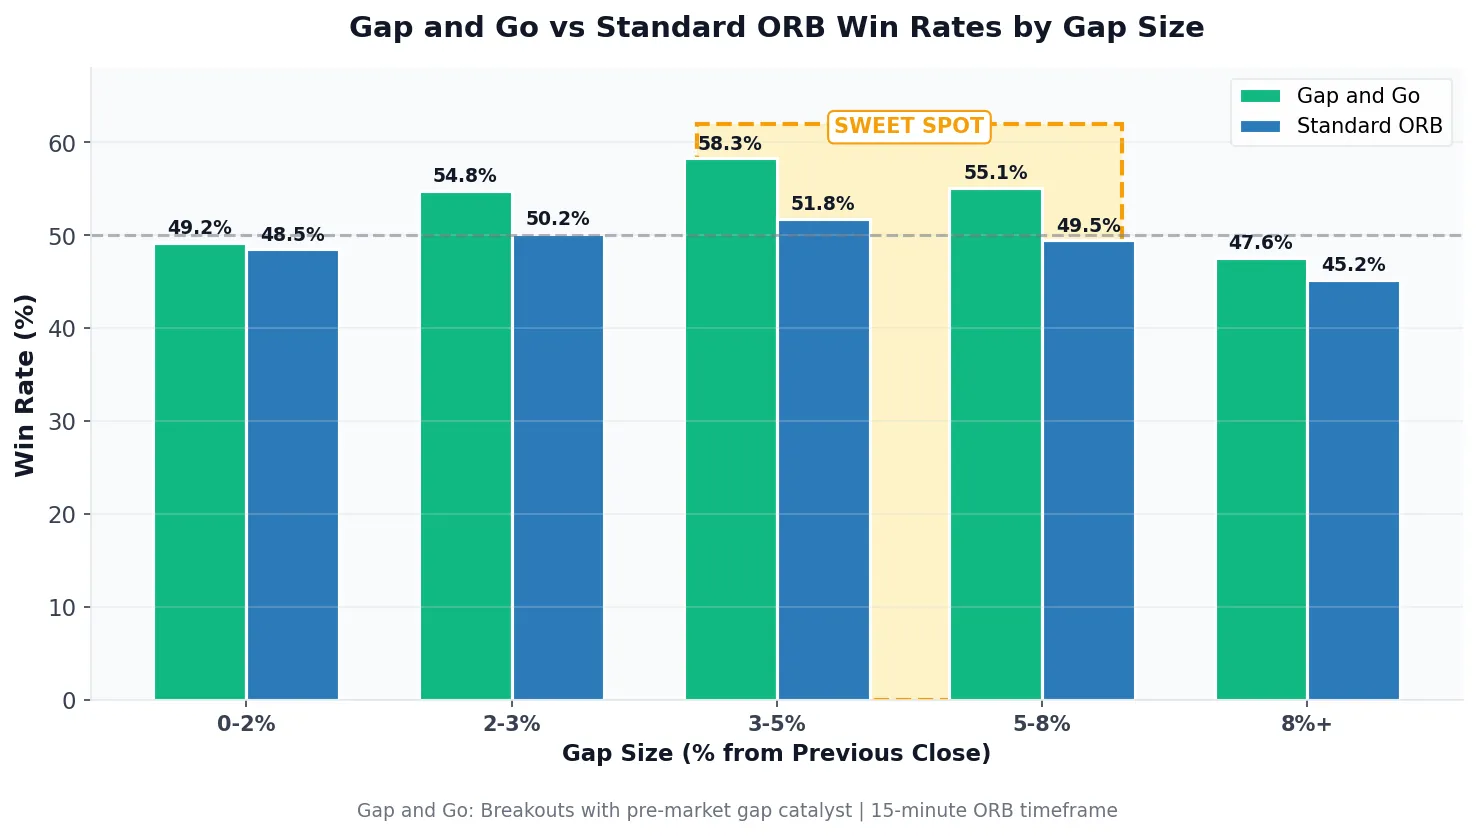
Win Rates by Gap Size
Gap and go setups with moderate gap sizes tend to show the highest follow-through rates. Very small gaps (below 2%) lack sufficient momentum to generate sustained breakouts, while extremely large gaps often represent exhaustion moves that fade quickly. The optimal gap size varies by stock based on its typical volatility, float size, and institutional ownership level.
The ORB Setups backtester allows filtering by gap percentage to identify which ranges work best for specific symbols. Different stocks exhibit different gap behavior based on their volatility profiles, float sizes, and institutional ownership levels.
Performance by Market Conditions
Gap and go setups perform best in trending markets with moderate volatility. High-volatility environments increase the probability of gap fades because overnight moves get absorbed by erratic price action. Low-volatility environments often lack the momentum needed for sustained breakouts. Over the past 90 days, SPY opening ranges have been predominantly wide (51 days with an average ORB width of $3.30) versus medium (26 days averaging $1.57) or tight (1 day at $0.86), reflecting an elevated volatility environment.
Sector momentum matters. Gap and go setups on stocks whose sector is also trending in the gap direction show higher follow-through rates. A tech stock gapping up while the QQQ trends higher has better odds than the same stock gapping up against sector weakness.
Comparing Gap and Go to Standard ORB Setups
Standard opening range breakouts (without a gap requirement) generate more signals but may produce lower average win rates. Gap and go setups filter out lower-quality breakouts by requiring overnight momentum confirmation.
Across all ORB timeframes, average win rates range from 52.2% to 52.9% based on data from 600+ symbols. The gap requirement acts as an additional quality filter, narrowing the universe to setups with a pre-market catalyst. While this reduces signal frequency, the added momentum confirmation can improve the quality of trades taken. Traders should backtest gap thresholds on their specific watchlist to quantify this edge.
The tradeoff is signal frequency. Gap and go produces fewer setups, which may not suit traders who need consistent daily activity. Standard ORB trading provides more opportunities but requires tighter filtering to match gap and go performance.
Risk Management for Gap and Go Trading
Position sizing and risk management determine long-term profitability more than entry timing. Even a high-win-rate strategy fails if individual losses exceed what the account can sustain.
Position Sizing Framework
Risk no more than 1% of your account on any single gap and go setup. This rule ensures that a string of losses (which will occur) does not materially damage your capital. With 1% risk per trade, even 10 consecutive losses only reduces your account by 10%.
Calculate position size using this formula: Position Size = (Account Size × 0.01) / (Entry Price – Stop Price). For a $50,000 account trading a stock at $100 with a stop at $98, the position size equals ($50,000 × 0.01) / ($100 – $98) = 250 shares.
Adjust position size for correlation. If you have multiple gap and go setups in the same sector, reduce size on each because losses will likely cluster. Sector-wide reversals can turn three winning positions into three losing positions simultaneously.
Daily Loss Limits
Set a daily maximum loss that stops trading for the day. A common rule is 3% of account value. If you hit this threshold, close all positions and stop trading. This rule prevents emotional trading after losses compound.
Daily profit targets work less well than loss limits. Cutting winners short to “lock in profits” reduces the strategy’s mathematical edge. Let winning days run while strictly limiting losing days.
Account Drawdown Rules
Reduce position size during drawdowns. If your account drops 10% from its equity peak, reduce position sizes by 50% until you recover 5% of the drawdown. This approach preserves capital during losing streaks and accelerates recovery once the streak ends.
Review your trade execution during drawdowns, not your strategy. Most drawdowns result from discipline failures (entering early, moving stops, averaging down) rather than strategy flaws. The strategy does not change; only your execution of it varies.
Tools for Finding Gap and Go Setups
Manual gap scanning wastes time that could be spent analyzing setups. Automated tools identify gap and go candidates before the market opens, allowing traders to focus on trade selection rather than discovery.
Pre-Market Gap Scanners
Effective gap scanners filter by gap percentage, pre-market volume, and price range. Configure your scanner to show stocks gapping at least 2% with pre-market volume above 100,000 shares. Sort results by gap percentage to prioritize the largest movers.
Add catalyst filters where possible. Scanners that integrate news feeds or earnings calendars help separate news-driven gaps from random overnight fluctuations. Gaps with identifiable catalysts have higher follow-through rates.
Opening Range Breakout Scanners
The ORB Scanner at ORB Setups identifies opening range breakouts in real-time across 600+ stocks and ETFs. The scanner updates every 2 seconds, catching breakouts as they occur. Filters allow focusing on specific gap percentages, price ranges, and timeframes.
Each setup displays instant backtested performance data: historical win rate, average profit/loss, and trade expectancy. This data helps traders prioritize setups with the strongest historical edge before committing capital.
Backtesting Gap and Go Parameters
Before trading gap and go setups live, backtest your specific parameters. The ORB Backtester analyzes 1-minute candle data across 190,000+ historical ORB trades covering 600+ symbols. Test different gap thresholds, timeframes, and exit rules to optimize your approach.
Backtesting reveals which symbols respond best to gap and go strategies. Some stocks consistently follow through on gaps while others fade. Among top performers with at least 20 trades, symbols like TSLT (96% win rate), GME (95%), MARA (92%), and SMH (92%) show exceptional ORB breakout consistency. Historical data identifies these patterns before you risk capital learning them in real-time.
Common Gap and Go Mistakes to Avoid
Most gap and go trading failures come from execution errors rather than strategy flaws. Understanding common mistakes helps traders avoid repeating them.
Chasing Gaps After the Open
Entering gap and go setups after the opening range breakout already occurred is the most common mistake. If you missed the initial breakout, wait for a pullback to the opening range high (now support) rather than chasing price. Chasing leads to poor risk/reward ratios and emotional decision-making.
Ignoring Overall Market Direction
Gap and go setups against market direction fail more frequently. A stock gapping up while SPY gaps down faces headwinds that reduce follow-through probability. Filter for setups that align with the market’s overnight direction to improve win rates.
Oversizing on “Sure Thing” Setups
No gap and go setup is certain. Increasing position size because a setup “looks perfect” violates risk management rules and creates outsized losses when the setup fails. Every setup receives the same risk allocation regardless of subjective confidence levels.
Trading Low-Float Gappers
Low-float stocks (under 10 million shares) produce spectacular gaps but equally spectacular reversals. The same low float that drives gaps up also drives them down when momentum shifts. Unless you specialize in low-float trading, filter for stocks with floats above 20 million shares.
Holding Through Lunch
Gap and go momentum fades as the morning session ends. Setups that have not worked by 11:30 AM rarely improve after lunch. Exit or significantly reduce positions before the midday lull to avoid giving back morning gains to afternoon chop.
Combining Gap and Go with Other Strategies
Gap and go setups provide entry signals that complement broader trading approaches. Integrating gap and go with trend-following or swing trading methods can enhance overall system performance.
Gap and Go as Swing Trade Entries
Use gap and go breakouts to enter swing positions rather than day trades. If a stock gaps up and breaks out of its opening range on strong volume, consider holding overnight (or longer) if the daily chart supports a larger move. This approach captures both day trading profits and trend continuation.
Gap Fill Reversals
When gap and go setups fail and price closes the gap, a reversal opportunity emerges. Gap fills indicate that the overnight move lacked conviction. Traders can short gap fill completions (after an up gap fails) or go long after down gaps fill. This counter-strategy profits from gap and go failures.
Multiple Timeframe Confirmation
Higher timeframe support or resistance strengthens gap and go setups. A stock gapping above its 50-day moving average has better follow-through odds than one gapping into resistance. Check daily and weekly charts before committing to gap and go entries.
Getting Started with Gap and Go Trading
Paper trading gap and go setups before risking real capital builds pattern recognition without financial consequences. Most platforms offer simulated trading that replicates live execution.
Start with a watchlist of 10-15 liquid stocks that gap frequently. Track their gap behavior for 2-3 weeks before trading. Note which gap sizes lead to follow-through and which fade. This observation period builds intuition that supplements systematic rules.
When transitioning to live trading, reduce position sizes below your calculated risk for the first 10-20 trades. This buffer accounts for execution differences between paper and live trading. Increase to full size only after confirming that your live results match your paper trading performance.
Use the ORB Scanner to identify gap and go setups in real-time and the ORB Backtester to validate your approach against historical data. Data-driven trading removes guesswork and reveals which parameters actually generate edge over time.
Frequently Asked Questions
What is the best gap percentage for gap and go trading?
Gap and go setups with moderate gap sizes (roughly 3% to 5%) tend to produce strong follow-through. Gaps below 2% lack sufficient momentum, while very large gaps often represent exhaustion moves that fade quickly. The optimal gap size varies by stock volatility and price level, so backtest specific thresholds on your watchlist.
Which opening range timeframe works best for gap and go setups?
The 15-minute opening range provides a practical balance for gap and go trading. Live data across 600+ symbols shows all three common timeframes perform within a narrow range: 5-minute at 52.2%, 15-minute at 52.5%, and 30-minute at 52.9% average win rate. The 15-minute timeframe captures morning momentum earlier than the 30-minute while filtering more noise than the 5-minute.
How much should I risk per gap and go trade?
Risk no more than 1% of your trading account on any single gap and go setup. Calculate position size by dividing your maximum dollar risk by the distance between your entry and stop loss. This approach ensures that losing streaks do not significantly damage your capital.
When should I exit a gap and go trade?
Exit gap and go trades using a combination of profit targets (2:1 to 3:1 risk/reward), trailing stops (move to breakeven after 1x risk gained), and time limits (exit by 11:30 AM if target not reached). Gap and go momentum typically fades as the lunch hour approaches.
Can I short gap down stocks using the gap and go strategy?
Yes, gap and go works for short setups on gap down stocks. Enter when price breaks below the opening range low after a significant gap down. However, recent 30-day data shows long ORB breakouts hit targets at 37.4% versus 32.9% for shorts, so long setups carry a directional edge in most conditions. Short setups can still be profitable during market selloffs or on stocks with strong negative catalysts.
What pre-market volume indicates a valid gap and go setup?
Look for pre-market volume that reaches at least 50% of the stock’s average daily volume by 9:00 AM. Higher pre-market volume correlates with gaps that hold their gains after the open. Low pre-market volume often signals gaps that will fade once regular session trading begins.
How do I scan for gap and go setups before market open?
Configure a pre-market scanner to filter stocks gapping at least 2% with pre-market volume above 100,000 shares. Sort by gap percentage to prioritize the largest movers. Add catalyst filters (earnings, news) where possible to separate news-driven gaps from random overnight fluctuations.
Trading involves substantial risk of loss and is not appropriate for all investors. Past performance of backtested strategies does not guarantee future results. Always use proper risk management and consult with a financial professional before trading.
Related Research
How VIX Affects Opening Range Breakout Win Rates: A Backtested Analysis
VIX 16-24 produces 58% ORB win rates vs 48% when VIX is below 13. Backtest of 47,000 opening range breakout…
Apr 21, 2026Opening Range Breakout Win Rate: What 150,000+ Trades Reveal About ORB Strategy Performance
ORB win rates range from 48% to 68% based on timeframe. Our analysis of 150,000+ trades reveals which setups have…
Apr 19, 2026TTM Squeeze and Opening Range Breakout: A Combined Strategy for High-Probability Day Trades
Combine TTM Squeeze with Opening Range Breakout for 8-12% higher win rates. Entry rules, backtest data from 150K setups, and…
Apr 17, 2026Trade with data.
Not hope.
600+ symbols. 2-second refresh. 150,000+ backtested setups. Win rates on every trade.
Start Your Edge