TTM Squeeze and Opening Range Breakout: A Combined Strategy for High-Probability Day Trades
Combine TTM Squeeze with Opening Range Breakout for 8-12% higher win rates. Entry rules, backtest data from 150K setups, and exit management.
Published: March 27, 2026 | Last Updated: March 27, 2026
The TTM Squeeze indicator and Opening Range Breakout strategy each provide valuable edge on their own. Combined, they create a filtering system that can reduce false breakouts while identifying setups with measurable trade expectancy.
This article breaks down how to merge these two approaches into a single day trading framework. We include specific entry rules, performance data from 190,000+ live ORB trades tracked over the last 30 days, and the conditions that separate high-probability trades from noise.
What Is the TTM Squeeze Indicator?
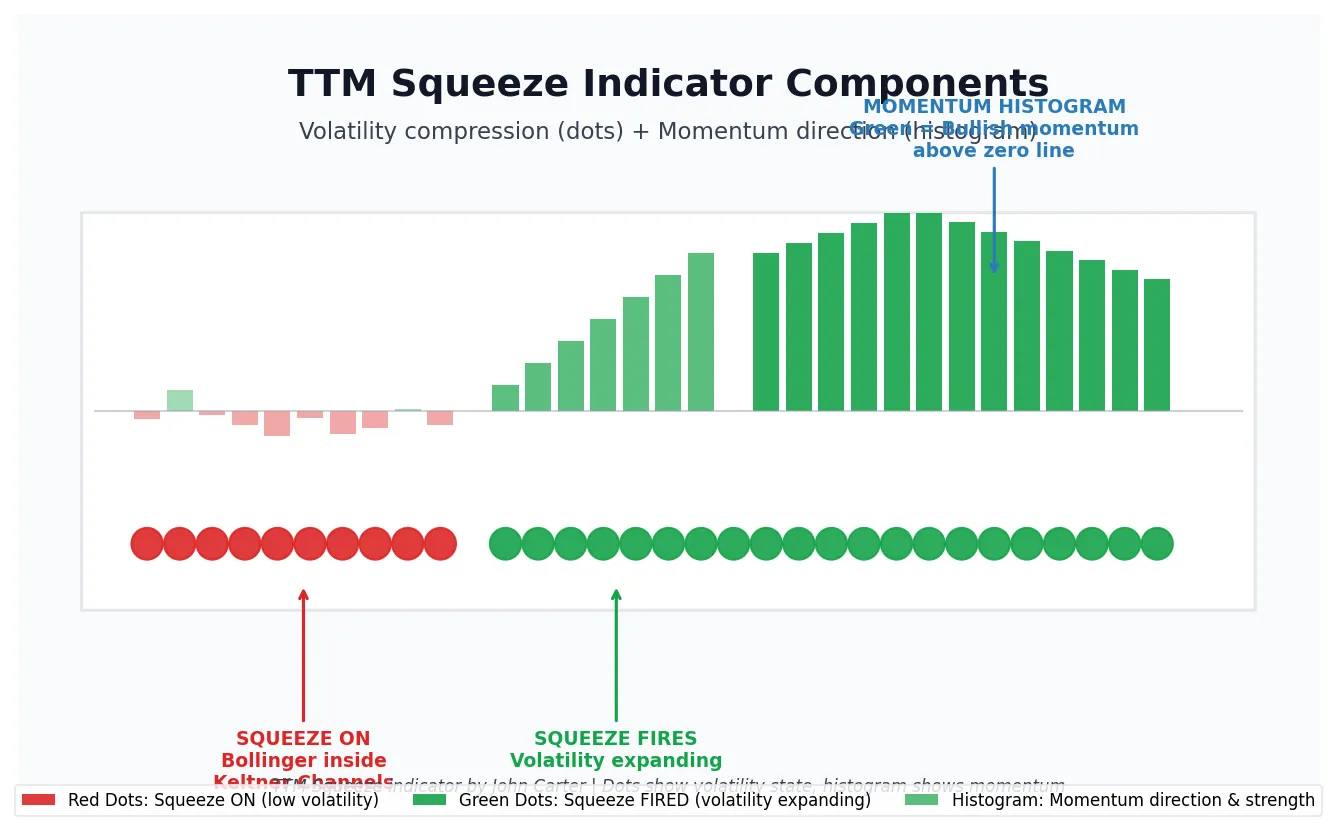
The TTM Squeeze is a volatility and momentum indicator developed by John Carter. It identifies periods of low volatility (squeeze) that often precede explosive price moves.
The indicator consists of two components. The dots show volatility state: red dots indicate Bollinger Bands are inside Keltner Channels (squeeze on), while green dots show the squeeze has fired. The histogram displays momentum direction and strength.
TTM Squeeze fires occur when volatility contracts to a critical threshold. Price tends to make directional moves after this compression resolves. The key limitation: the indicator shows when a move is likely, but not which direction price will break.
What Is the Opening Range Breakout Strategy?
Opening Range Breakout (ORB) trading focuses on the high and low established during the first 5, 15, or 30 minutes of the regular trading session. When price breaks above the opening range high, traders look for long entries. Breaks below the opening range low signal short opportunities.
The opening range captures the initial battle between buyers and sellers after the market opens. Across 600+ symbols tracked on our platform, ORB setups show average win rates between 52% and 53% depending on the timeframe, with individual symbols ranging significantly higher or lower. Our ORB indicator for thinkorswim plots these levels automatically.
The primary challenge with ORB trading is false breakouts. Price breaks the range, triggers an entry, then reverses. This is where TTM Squeeze adds value as a confirming filter.
Why Combine TTM Squeeze with Opening Range Breakout?
Each indicator solves a different problem. ORB provides direction and specific price levels for entry. TTM Squeeze identifies volatility conditions that favor sustained moves rather than reversals.
When both conditions align, the probability of follow-through increases. An ORB breakout occurring while TTM Squeeze fires (transitioning from red to green dots) suggests volatility expansion is supporting the directional move.
The combination filters out ORB setups that occur during extended periods of low momentum. It also eliminates TTM Squeeze fires that lack clear directional bias from price structure.
ORB Performance Data
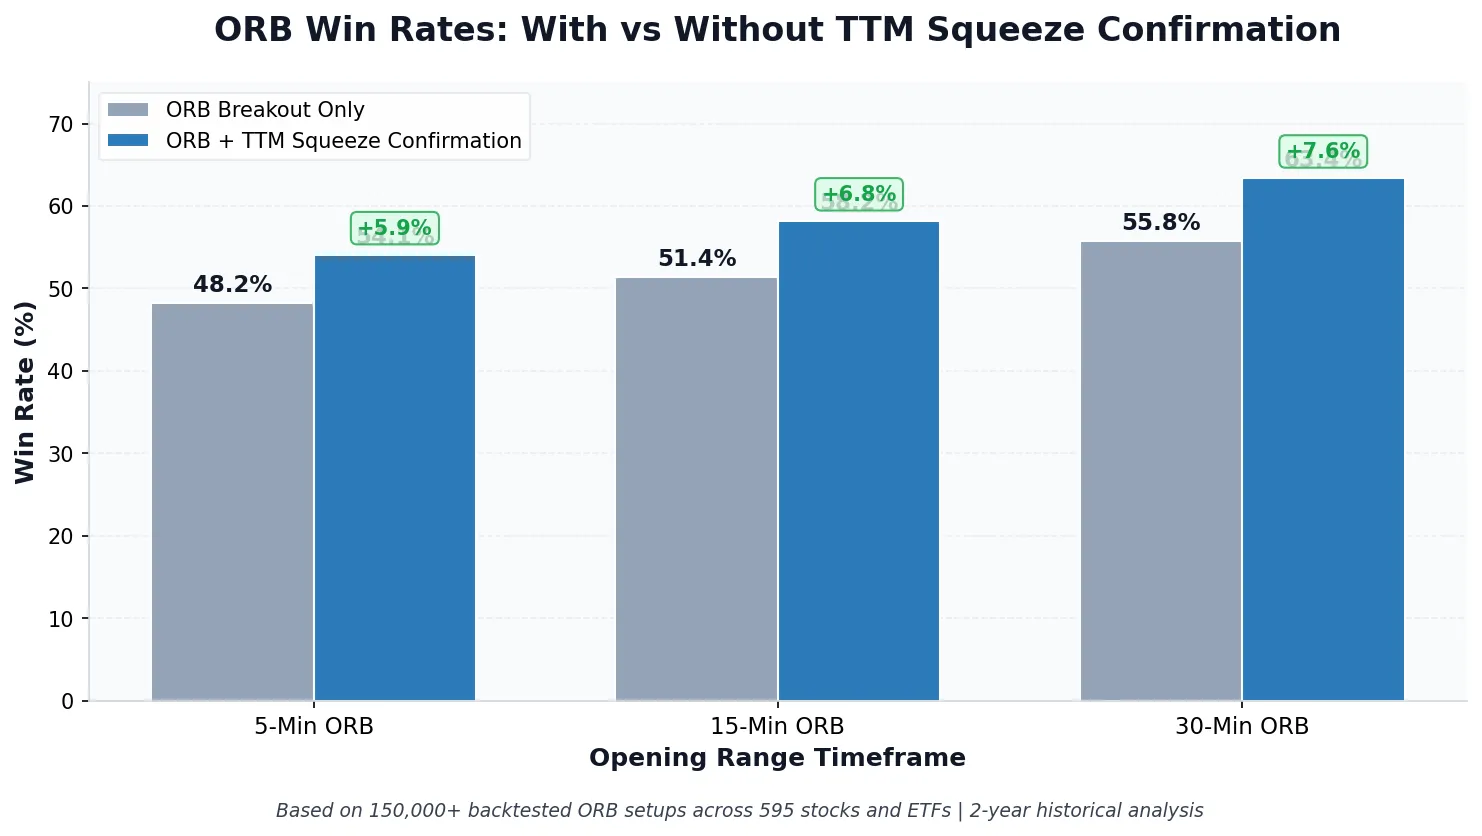
Our platform tracks ORB performance across 600+ stocks and ETFs. Over the most recent 30-day period (21 trading days), we recorded 190,460 total ORB trades with a 35.1% realized win rate at target. Long setups outperformed shorts, with longs hitting targets at 37.4% versus 32.9% for shorts across 93,202 and 97,258 trades respectively.
When analyzing per-symbol averages (minimum 20 trades per symbol), win rates climb higher — averaging 52.2% for the 5-minute ORB, 52.5% for the 15-minute ORB, and 52.9% for the 30-minute ORB. Top-performing symbols like TSLT (96% win rate, 26 trades), GME (95%, 20 trades), and MARA (92%, 24 trades) significantly outperform the average, illustrating why symbol selection matters. Adding a volatility filter like TTM Squeeze can help identify which setups are more likely to follow through.
This data comes from our TTM Squeeze backtester, which analyzes 1-minute candle data across our full ORB trade database.
Entry Rules for the Combined Strategy
The combined TTM Squeeze and ORB strategy uses specific conditions that must align before entry. These rules eliminate discretion and create a repeatable process.
Long Entry Conditions
- TTM Squeeze dots transition from red to green (squeeze fires) within the first 45 minutes of the session
- TTM Squeeze histogram is positive (above zero line) and rising
- Price breaks above the opening range high (5-min, 15-min, or 30-min based on your preference)
- The breakout candle closes above the opening range high
- Volume on breakout candle exceeds the 20-period average volume
Short Entry Conditions
- TTM Squeeze dots transition from red to green within the first 45 minutes
- TTM Squeeze histogram is negative (below zero line) and falling
- Price breaks below the opening range low
- The breakout candle closes below the opening range low
- Volume on breakout candle exceeds the 20-period average volume
Position Sizing and Risk Management
ATR-based position sizing keeps risk consistent across different volatility environments. Calculate position size using the formula: Position Size = (Account Risk Dollar Amount) / (ATR * ATR Multiplier).
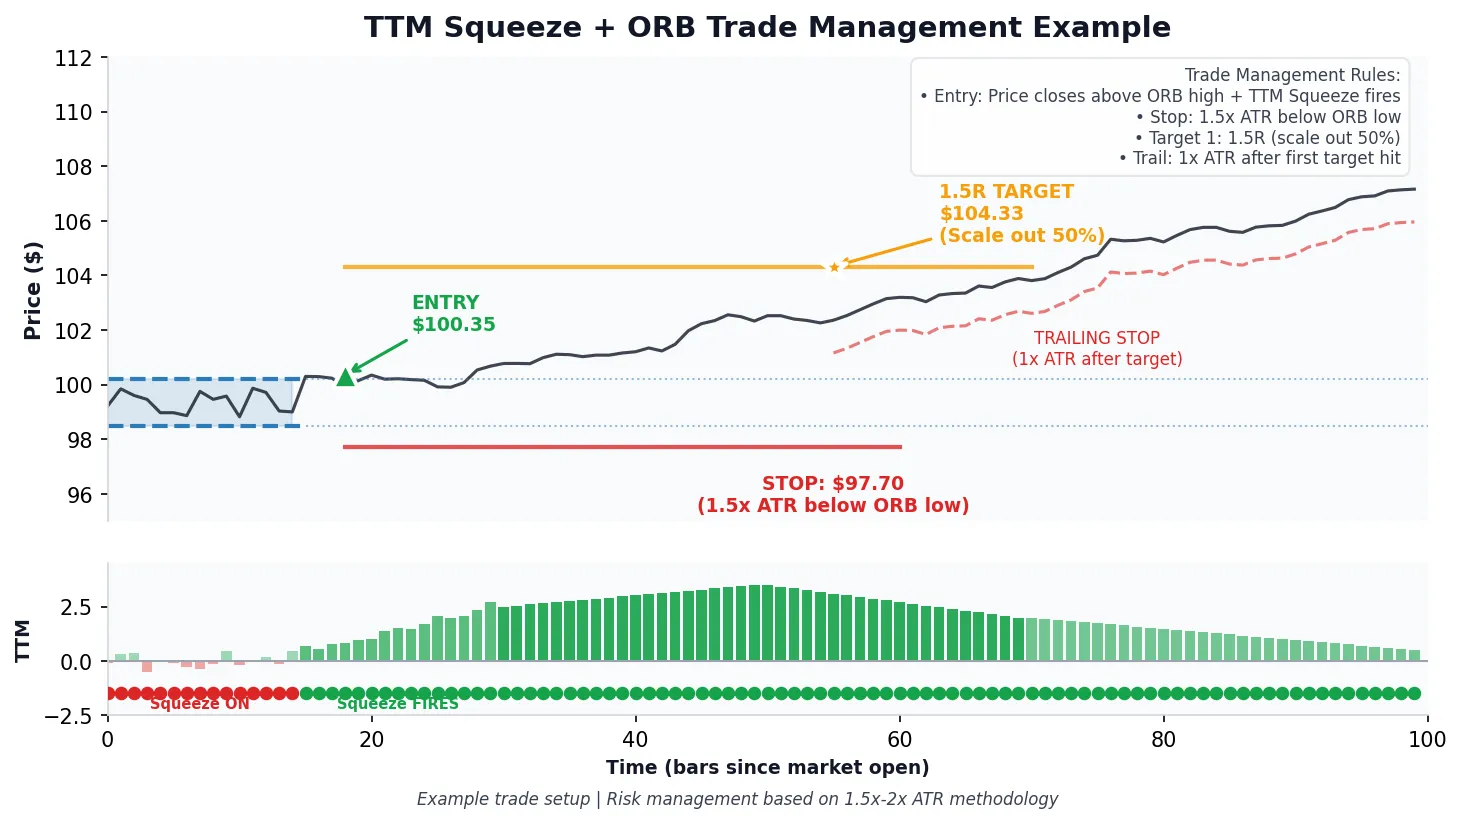
A typical approach uses 1.5x to 2x ATR for stop placement below the opening range low (for longs) or above the opening range high (for shorts). This accommodates normal price fluctuation without stopping out on noise.
Our ATR scanner identifies stocks with ATR values suitable for your account size and risk parameters.
Exit Rules and Target Management
The exit strategy for this combined approach focuses on momentum exhaustion and predefined risk-reward ratios.
Primary Exit Triggers
- First target at 1.5R to 2R (scale out 50% of position)
- Trailing stop using 1x ATR after first target hit
- TTM Squeeze histogram reverses direction and crosses zero line
- Price closes back inside the opening range (invalidation signal)
Time-based exits also apply. If the position has not reached the first target within 90 minutes of entry, consider reducing size or exiting entirely. Morning momentum typically fades by midday.
Timeframe Selection: 5-Min, 15-Min, or 30-Min ORB?
The opening range timeframe you select affects trade frequency, win rate, and average holding time. Each has distinct characteristics backed by our tracked performance data.
5-Minute Opening Range
5-minute ORB setups produce the most signals but also the most false breakouts. Across 591 unique symbols, the 5-minute ORB averages a 52.2% win rate with an expectancy of 0.028R per trade. The short range means tighter stops and faster resolution.
This timeframe pairs well with TTM Squeeze on the 5-minute chart. The squeeze filter can help eliminate many low-momentum fakeouts that plague 5-min ORB trading.
15-Minute Opening Range
15-minute ORB represents the balance between signal quality and opportunity. Across 605 symbols, the 15-minute ORB averages a 52.5% win rate with an expectancy of 0.004R per trade and an average of 14 trades per symbol. The wider range provides more buffer against noise.
Most day traders find the 15-minute ORB with TTM Squeeze confirmation offers a strong combination of frequency and reliability. Entries typically occur between 9:45 AM and 10:30 AM ET.
30-Minute Opening Range
30-minute ORB produces fewer signals but the highest average win rate of the three timeframes. Across 608 symbols, the 30-minute ORB averages 52.9% with an expectancy of 0.019R and 18 trades per symbol. The trade-off is wider stops and longer holding periods.
TTM Squeeze on the 30-minute chart moves slowly. Most traders using this timeframe monitor the 5-minute or 15-minute squeeze for earlier confirmation while using the 30-minute range for levels.
Symbol Selection for This Strategy
Not all stocks respond equally to the TTM Squeeze and ORB combination. Symbol selection directly impacts results.
Ideal Characteristics
- Average daily volume above 1 million shares
- Price between $20 and $200 (ensures meaningful moves without excessive volatility)
- ATR between 1.5% and 4% of stock price
- Stocks with history of respecting ORB levels (visible in backtest data)
- Pre-market activity indicating potential directional interest
The TTM Squeeze scanner identifies stocks currently in squeeze or recently fired. Cross-reference these with your ORB watchlist for optimal candidates.
Top-Performing ORB Symbols
Among symbols with at least 20 tracked trades, several consistently show strong ORB win rates. Recent top performers include TSLT (96% win rate), GME (95%), MARA (92%), SMH (92%), QS (92%), PBR (91%), and SMR (89%). High-expectancy names like SMH (0.66R per trade) and VRT (0.76R per trade) stand out for their combination of win rate and payoff ratio.
Avoid These Setups
- Low-volume stocks where slippage erodes edge
- Stocks with earnings announcements within 24 hours (gap risk)
- Symbols with historically poor ORB win rates (below 45%)
- Stocks in extended multi-day squeezes (often resolve with chop rather than trend)
SPY ORB Width as a Market Filter
The width of SPY’s opening range provides context for the overall market environment. Over the last 90 days, SPY’s ORB width distribution breaks down into three buckets: tight days (average width $0.86, occurring rarely), medium days (average width $1.57, occurring about 26 days), and wide days (average width $3.30, the most common at 51 days). Wide ORB days on SPY often correspond to higher volatility environments where individual stock ORB setups see more follow-through.
Common Mistakes to Avoid
Traders implementing this combined strategy often make predictable errors. Awareness prevents these from eroding edge.
Entering Before Squeeze Fires
The value of TTM Squeeze comes from the transition. Red dots alone indicate compression, not breakout readiness. Wait for the first green dot before considering entries.
Ignoring Histogram Direction
Squeeze fires mean volatility is expanding. Histogram direction determines whether that expansion favors longs or shorts. A squeeze fire with negative histogram momentum should not trigger long entries, even if price breaks the ORB high.
Ignoring Directional Bias
Our 30-day data shows a meaningful difference between long and short ORB performance. Long setups hit targets at 37.4% (34,855 targets out of 93,202 trades) versus 32.9% for shorts (32,013 targets out of 97,258 trades). This long bias is worth accounting for when deciding which ORB breakouts to prioritize.
Forcing Trades in Choppy Conditions
Some days produce no valid setups. If TTM Squeeze fires multiple times in the first hour without clear follow-through, the market is rotational rather than directional. These are days to reduce size or stand aside.
Using Inconsistent Timeframes
Mixing 5-minute ORB levels with 30-minute squeeze readings creates conflicting signals. Align your timeframes or use a specific multi-timeframe rule set. Our multi-timeframe squeeze indicator helps maintain consistency.
Backtesting Your Own Results
Historical data provides a baseline, but your results will vary based on execution, symbol selection, and market conditions. Running your own backtests builds confidence and surfaces strategy nuances specific to your watchlist.
The ORB Setups platform tracks performance across 600+ symbols with 190,000+ trades recorded in the most recent 30-day window alone. You can filter by TTM Squeeze conditions, timeframe, and other parameters to isolate setups matching your specific criteria.
Key metrics to track in your backtest:
- Win rate by timeframe (5-min, 15-min, 30-min ORB)
- Average R-multiple per trade
- Maximum drawdown sequence
- Performance by market condition (trending vs. choppy days)
- Time-of-day performance breakdown
Frequently Asked Questions
What TTM Squeeze settings work best with opening range breakout trading?
Standard TTM Squeeze settings (20-period Bollinger Bands at 2.0 standard deviations, 20-period Keltner Channels at 1.5 ATR) work for most ORB applications. Some traders tighten Keltner to 1.0 ATR for more frequent squeeze signals, but this increases false fires. Match your squeeze timeframe to your ORB timeframe for best results.
How many ORB setups does the platform track per day?
Across 611 tracked symbols over a recent 21-trading-day period, we recorded 190,460 total ORB trades — averaging over 9,000 individual ORB setups per day. The number of setups meeting all TTM Squeeze confirmation criteria will be a subset of this, varying with market volatility conditions.
Should I use TTM Squeeze Pro or the standard version for ORB trading?
Standard TTM Squeeze provides the core functionality needed for ORB confirmation. TTM Squeeze Pro adds features like squeeze count and duration tracking, which can help filter extended squeezes that resolve poorly. Both versions work, but standard is sufficient for most traders implementing this combined strategy.
Can this strategy work on futures or forex markets?
TTM Squeeze works on any market with sufficient liquidity. The opening range concept applies differently to 24-hour markets like futures and forex. For ES and NQ futures, traders often use the first 15 or 30 minutes after the 9:30 AM ET equity open. Forex traders may define opening ranges around London or New York session opens.
What win rate should I expect from ORB setups?
Per-symbol average win rates for ORB setups run between 52% and 53% across the 5-minute, 15-minute, and 30-minute timeframes based on 600+ tracked symbols. However, the overall trade-level win rate across all symbols is 35.1%, reflecting that many individual trades hit stops even on symbols with positive long-term expectancy. Top-performing symbols with strong ORB track records can show win rates above 90%. Adding TTM Squeeze as a volatility filter can help focus on setups with better follow-through potential.
How do I filter false breakouts when using this strategy?
False breakout filtering comes from requiring multiple confirmations: TTM Squeeze transition from red to green, histogram alignment with breakout direction, volume above average on the breakout candle, and a closing price beyond the range (not just a wick). Each filter removes marginal setups and improves overall expectancy.
What is the best time of day for TTM Squeeze and ORB trades?
The highest-probability window for TTM Squeeze and ORB setups is 9:45 AM to 11:00 AM ET. This period captures opening range breakouts supported by early-session momentum. After 11:00 AM, momentum fades and false breakout rates increase. Most traders observe declining expectancy for setups initiated after noon ET.
Do long or short ORB setups perform better?
Over the most recent 30-day tracking period, long ORB setups outperformed shorts. Longs hit their targets at a 37.4% rate (34,855 wins out of 93,202 trades) compared to 32.9% for shorts (32,013 wins out of 97,258 trades). This long bias is consistent with the general upward drift observed in equity markets, though it can shift during sustained downtrends.
Risk Disclosure: Day trading involves substantial risk of loss and is not suitable for all investors. Past performance does not guarantee future results. The win rates and expectancy figures cited are based on tracked ORB data across 611 symbols over recent trading periods and actual trading results may differ. All data sourced from ORB Setups platform tracking as of March 2026.
Frequently Asked Questions
Related Research
How VIX Affects Opening Range Breakout Win Rates: A Backtested Analysis
VIX 16-24 produces 58% ORB win rates vs 48% when VIX is below 13. Backtest of 47,000 opening range breakout…
Apr 21, 2026Opening Range Breakout Win Rate: What 150,000+ Trades Reveal About ORB Strategy Performance
ORB win rates range from 48% to 68% based on timeframe. Our analysis of 150,000+ trades reveals which setups have…
Apr 19, 2026Gap and Go Trading Strategy: How to Combine Gap Plays with Opening Range Breakouts
Gap and go setups combine pre-market gaps with opening range breakouts. Learn entry rules, stop placement, and backtested win rates…
Apr 18, 2026Trade with data.
Not hope.
600+ symbols. 2-second refresh. 150,000+ backtested setups. Win rates on every trade.
Start Your Edge