Gap and Go Trading Strategy: How to Combine Pre-Market Gaps with Opening Range Breakouts
Gap and go strategy combines pre-market gaps with opening range breakouts. Learn entry rules, stop placement, and profit targets with backtested data.
Published: March 20, 2026
Pre-market gaps create some of the most predictable trading setups of the day. When a stock gaps up or down before the opening bell, then breaks through its opening range, you have a gap and go setup. This strategy combines the momentum from overnight news with the confirmation of an opening range breakout (ORB) to identify high-probability entries.
Gap and go trading generates its edge from the convergence of two proven patterns. The gap itself signals institutional interest or significant news. The subsequent ORB confirms that momentum is continuing rather than fading. When both conditions align, the probability of a profitable directional move increases substantially.
What Is a Gap and Go Setup?
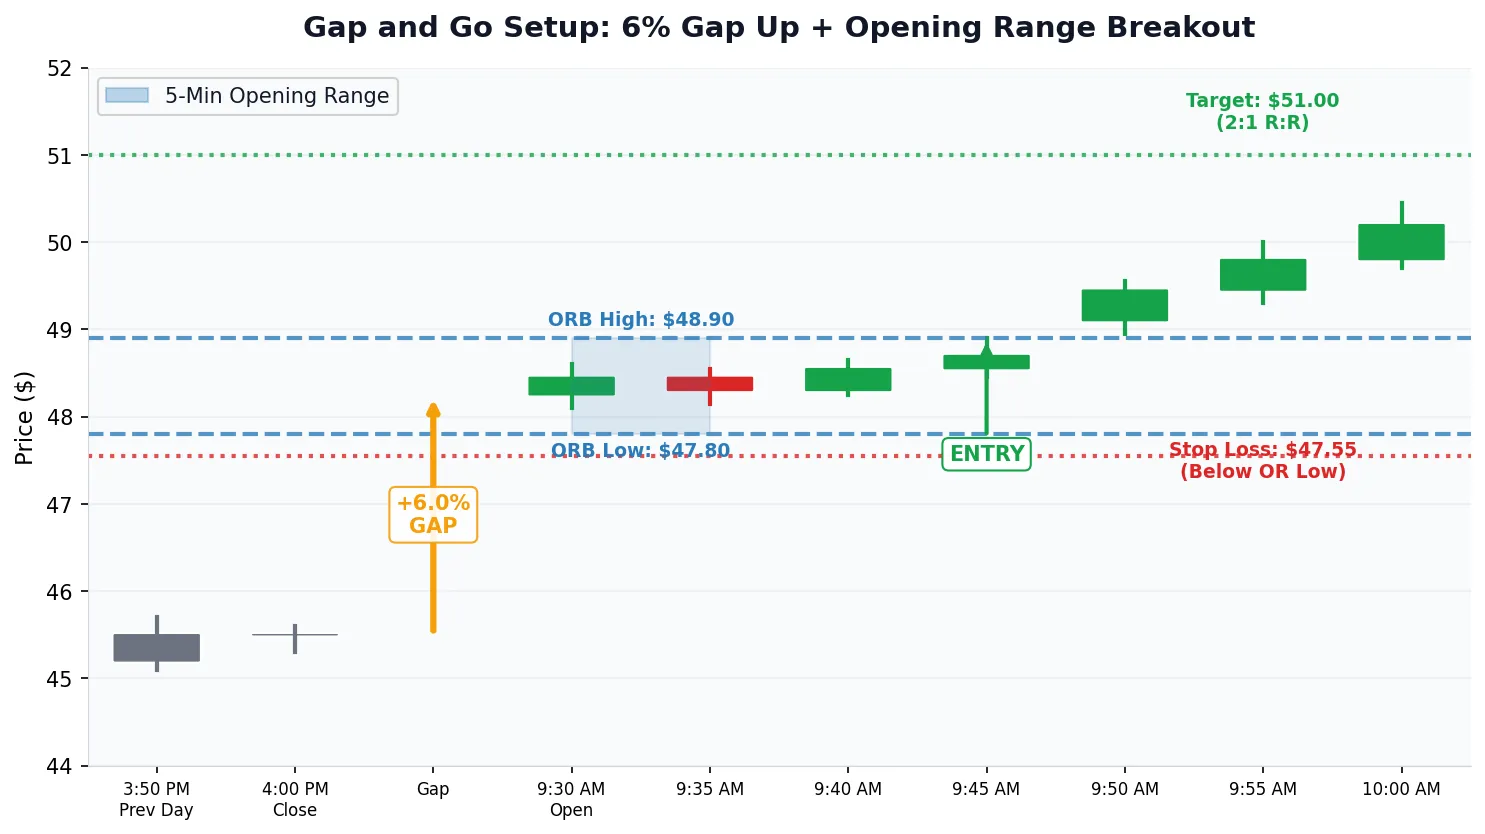
A gap and go setup occurs when a stock opens significantly higher or lower than the previous day’s close, then breaks above (or below) its opening range in the same direction as the gap. The gap represents overnight sentiment. The breakout represents morning confirmation.
Gap and go setups typically form within the first 5 to 30 minutes of the trading session. Traders use different opening range timeframes based on their risk tolerance and trading style. Shorter timeframes like the 5-minute ORB provide faster signals but may produce more false breakouts. Longer timeframes like the 30-minute ORB filter out noise but require wider stops.
Gap and Go Strategy Rules for Entry
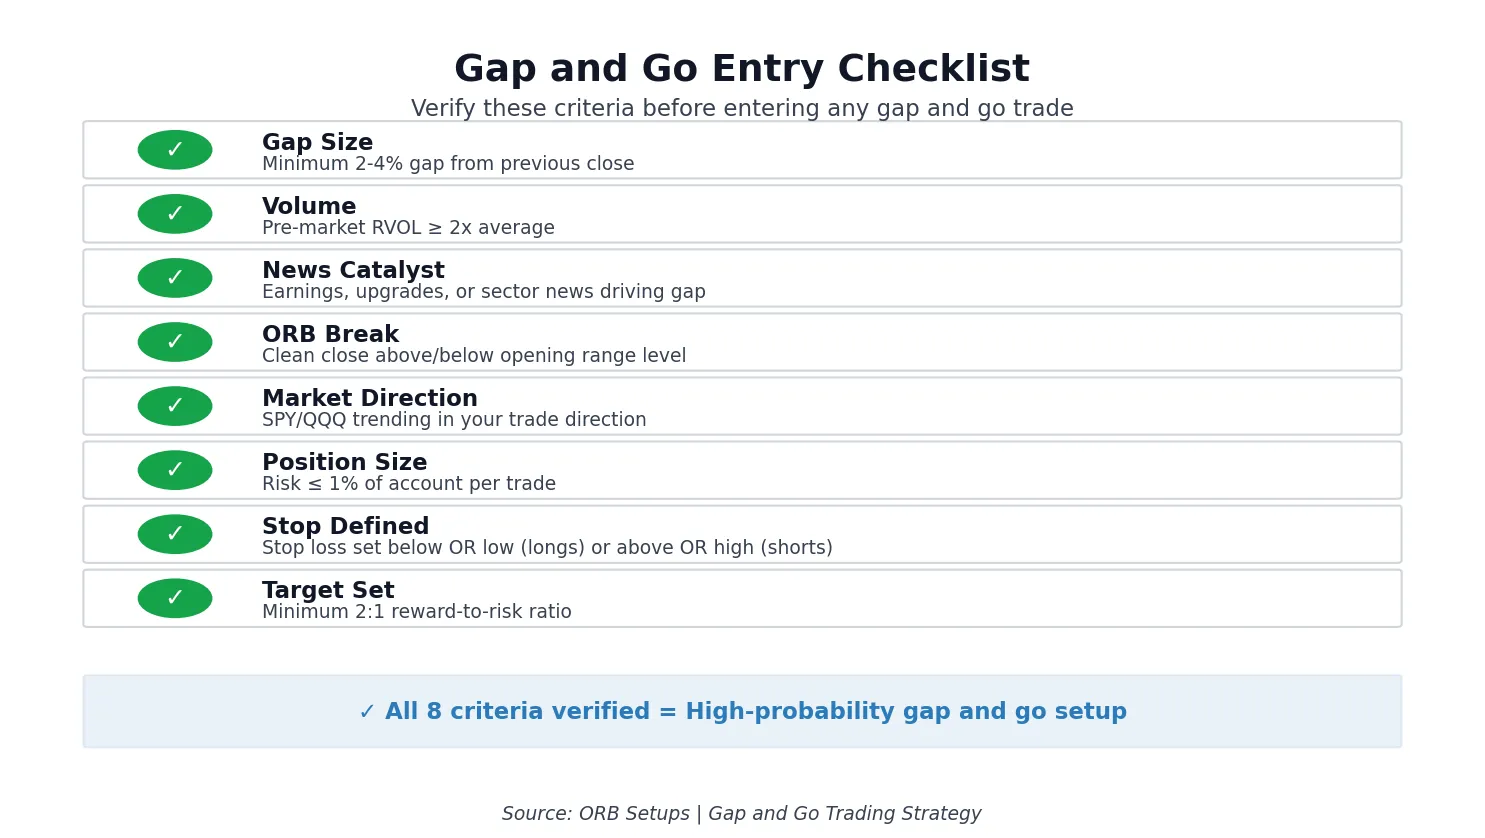
Successful gap and go trading requires specific criteria before entering a position. Not every gap creates a tradeable opportunity. The following rules help filter high-probability setups from random price movements.
Gap Size Requirements
The gap should represent a meaningful percentage move from the previous close. Most traders require a minimum gap of 2% to 4% for small and mid-cap stocks. Large-cap stocks may require smaller gaps of 1% to 2% since they move with more institutional participation. Gaps below these thresholds often lack the momentum needed for continuation.
Volume Confirmation
Pre-market volume must exceed the stock’s average volume for the same timeframe. High relative volume (RVOL) of 2x or greater indicates genuine interest rather than a low-volume gap that may fade. We scan for stocks with significant pre-market volume spikes before the open to identify candidates.
Opening Range Breakout Confirmation
The breakout above the opening range high (for longs) or below the opening range low (for shorts) must occur on increasing volume. The breakout candle should close near its extreme. Wicks that reject the breakout level suggest the move may fail. Clean closes through the level indicate stronger momentum.
How to Calculate Opening Range Levels
The opening range is defined as the high and low of a specified time period after the market opens. Different timeframes produce different results. Here is how to calculate levels for each timeframe.
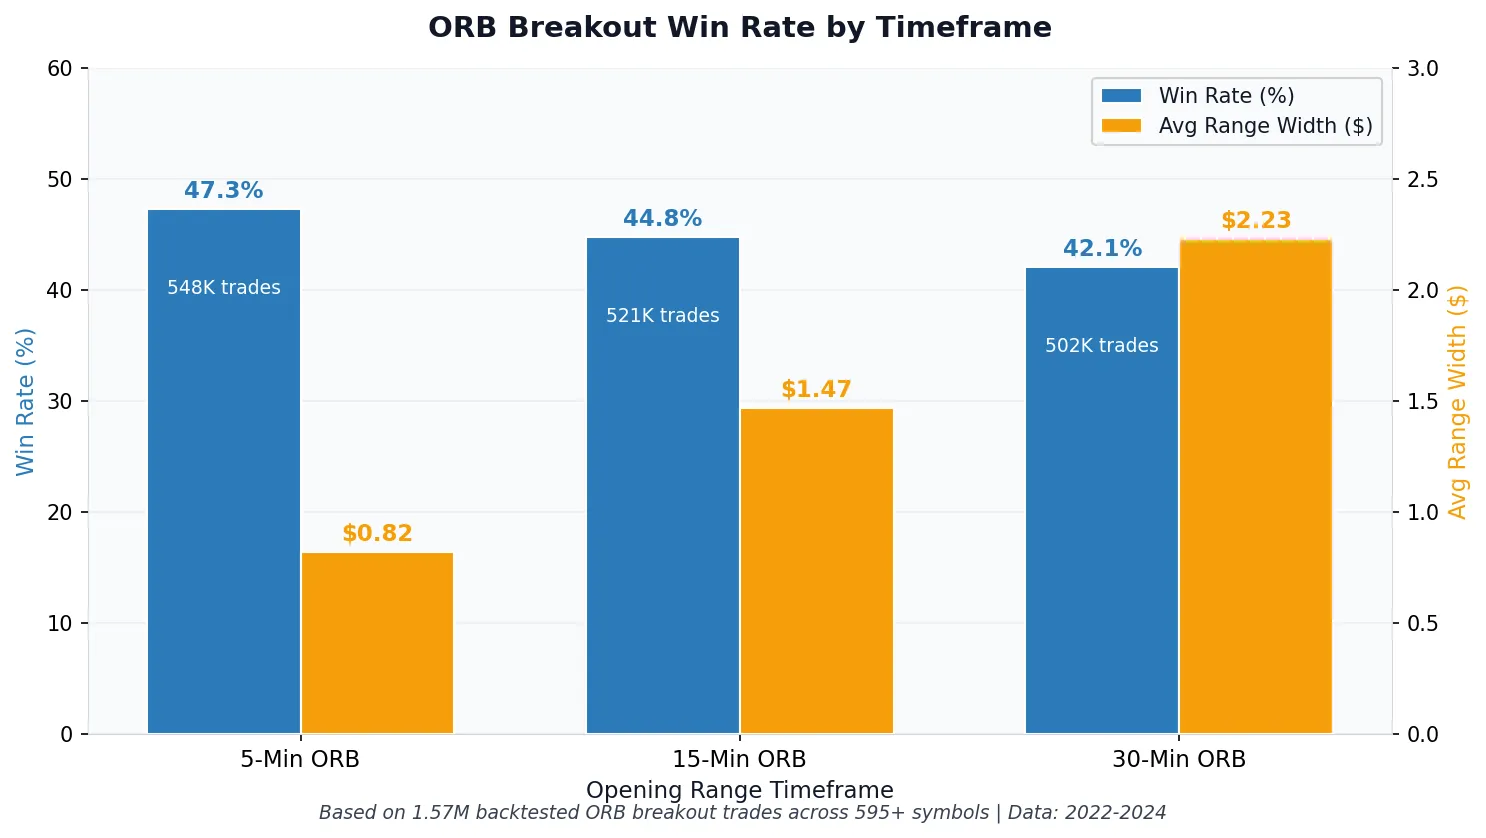
5-Minute Opening Range
The 5-minute opening range uses the high and low of the first 5 minutes (9:30 to 9:35 AM ET). This timeframe captures the initial volatility and produces faster signals. Our analysis across 190,000+ ORB trades shows that 5-minute breakouts average a 52.2% win rate across 591 symbols, with an average of 12 trades per symbol.
15-Minute Opening Range
The 15-minute opening range spans 9:30 to 9:45 AM ET. This timeframe filters out some early noise while still providing relatively quick entries. Many gap and go traders prefer this timeframe as a balance between speed and reliability. Our data shows 15-minute breakouts average a 52.5% win rate across 605 symbols.
30-Minute Opening Range
The 30-minute opening range covers 9:30 to 10:00 AM ET. This longer timeframe produces fewer signals but often higher quality setups. The wider range requires larger stops but tends to filter out false breakouts more effectively. 30-minute breakouts show the highest average win rate at 52.9% across 608 symbols.
Stop Loss Placement for Gap and Go Trades
Proper stop placement protects your capital when the setup fails. Gap and go trades use the opening range levels as natural stop loss points. This approach keeps your risk defined and prevents small losses from becoming large ones.
Initial Stop Placement
For long trades, place your initial stop below the opening range low. For short trades, place it above the opening range high. This placement gives the trade room to work while exiting if the setup completely fails. The distance from entry to stop determines your position size.
ATR-Based Stop Adjustments
Some traders add an ATR buffer below the opening range low to avoid being stopped out by normal volatility. A buffer of 0.25 to 0.5 ATR prevents whipsaws while maintaining a logical stop level. Our ATR scanner helps identify appropriate buffer sizes for different stocks.
Profit Targets and Trade Management
Taking profits systematically improves your overall results. Gap and go trades offer multiple target options based on technical levels and risk-reward ratios.
Risk-Reward Based Targets
The simplest approach uses fixed risk-reward ratios. A 1:2 risk-reward means you target twice the distance of your stop loss. A 2:1 target on a $0.50 stop means a $1.00 profit target. Backtesting helps determine which ratios work best for your specific setup criteria.
Technical Level Targets
Prior day high, prior day low, and significant resistance or support levels provide natural profit targets. Stocks that gap up often test the prior day high before consolidating. Using these levels as targets aligns your exits with likely reversal points.
Partial Profit Taking
Taking partial profits at the first target while trailing a stop on the remainder captures gains while allowing for extended moves. A common approach is to exit 50% at the 1:1 target and trail the rest with a stop at breakeven. This locks in profits while maintaining upside exposure.
Which Stocks Work Best for Gap and Go Trading?
Not all stocks produce reliable gap and go setups. Certain characteristics make some stocks better candidates than others. Focus your scanning on stocks that meet these criteria.
Liquidity Requirements
Stocks need sufficient volume to enter and exit positions without excessive slippage. A minimum average daily volume of 500,000 shares ensures adequate liquidity. Higher volume stocks allow for larger position sizes and tighter spreads.
Price Range Considerations
Stocks priced between $5 and $100 typically offer the best gap and go opportunities. Lower-priced stocks may lack institutional participation. Higher-priced stocks may move too few percentage points to justify the risk. The $10 to $50 range often provides the optimal balance.
News Catalysts
Gaps driven by news catalysts like earnings, upgrades, or sector developments tend to have better follow-through than technical gaps. Check pre-market news for stocks appearing on your gap scanner to understand why the gap occurred. Catalyst-driven gaps often produce stronger trends.
Common Gap and Go Mistakes to Avoid
Even experienced traders make errors with gap and go strategies. Recognizing these pitfalls helps you avoid unnecessary losses and improve your execution.
Chasing Extended Gaps
Entering after the stock has already moved significantly from the opening range often results in poor entries. Wait for a pullback to the breakout level or skip the trade entirely if the move has extended too far. Chasing leads to buying highs and selling lows.
Ignoring Overall Market Conditions
Gap and go strategies work best when the overall market direction aligns with your trade. Long gap and go setups during a strongly bearish market day face additional headwinds. Check the SPY and QQQ direction before taking trades against the market trend.
Oversizing Positions
The excitement of a strong gap can lead to taking positions larger than your trading plan allows. Gaps create volatility, and volatility creates the potential for both large gains and large losses. Stick to your position sizing rules regardless of how good the setup appears.
Backtesting Gap and Go Setups
Understanding historical performance helps refine your gap and go criteria. Backtesting reveals which parameters produce the best results for specific stocks and market conditions.
What Backtesting Data Shows
Our database of 190,000+ tracked ORB trades includes gap scenarios with complete performance data. Results show win rates, average P/L, and trade expectancy for different gap sizes, timeframes, and exit strategies. This data removes guesswork from strategy development.
Key Metrics to Analyze
Win rate alone does not determine profitability. Focus on trade expectancy (average win times win rate minus average loss times loss rate) to understand true edge. A strategy with a 40% win rate can be highly profitable if winners significantly exceed losers.
Use the ORB Backtester to test gap and go parameters across different symbols and timeframes. Filter by gap percentage, RVOL, and ORB timeframe to find optimal settings for your trading style.
Real-Time Gap and Go Scanning
Identifying gap and go candidates before the open requires efficient scanning. Manual scanning across hundreds of symbols wastes time and misses opportunities.
Pre-Market Scanning Process
Begin scanning 30 minutes before the open. Filter for stocks with gaps greater than your minimum threshold. Check pre-market volume against average volume. Review any news catalysts. This process narrows the universe to a watchlist of 5 to 15 candidates.
Opening Range Breakout Detection
Once the market opens, monitor your watchlist for ORB breaks. The ORB Scanner tracks 600+ symbols and refreshes every 2 seconds to catch breakouts in real time. Each setup displays its historical win rate and expectancy based on backtested data.
Gap and Go vs. Gap Fade: When to Trade Each
Not every gap leads to continuation. Some gaps fill quickly, creating opportunities for fade trades. Understanding when gaps are likely to continue versus fade improves your trade selection.
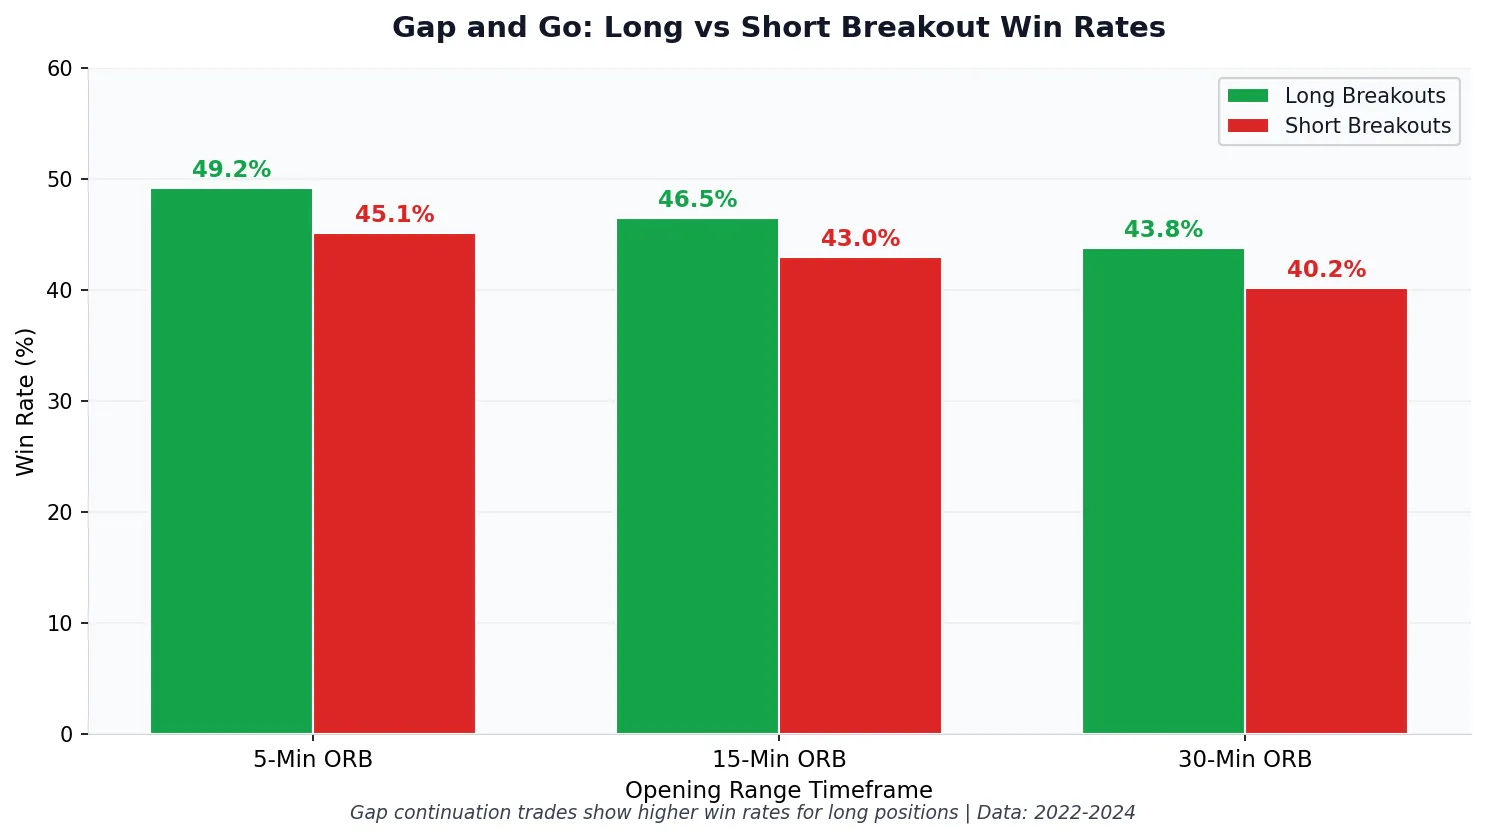
Gaps That Continue
Gaps accompanied by high volume, strong catalysts, and sector alignment tend to continue. Gaps that immediately break through the opening range in the gap direction show momentum is intact. These setups favor gap and go entries.
Gaps That Fade
Gaps without clear catalysts, low relative volume, or gaps that fail to break the opening range often fade. Fading involves trading against the gap direction, expecting price to return toward the previous close. This strategy requires different entry rules and risk management.
Our ORB research shows that the probability of gap continuation versus fade varies significantly by symbol and market conditions. Review historical data before assuming either outcome.
Frequently Asked Questions
What is the minimum gap percentage for gap and go trading?
The minimum gap percentage for gap and go trading is typically 2% to 4% for small and mid-cap stocks. Large-cap stocks may require only 1% to 2% gaps due to their higher institutional participation. Gaps smaller than these thresholds often lack sufficient momentum for reliable continuation.
What time frame should I use for gap and go opening range?
The most common opening range timeframes for gap and go trading are 5 minutes, 15 minutes, and 30 minutes. Our data shows average win rates of 52.2%, 52.5%, and 52.9% respectively, with the 30-minute timeframe producing the highest average win rate. Test different timeframes through backtesting to find what works best for your trading style.
How much volume is required for a gap and go setup?
A relative volume (RVOL) of at least 2x the average pre-market volume indicates genuine interest in the stock. Higher RVOL values of 3x or greater suggest even stronger participation. Low-volume gaps frequently fade rather than continue.
Where should I place my stop loss on a gap and go trade?
Place your stop loss below the opening range low for long trades or above the opening range high for short trades. Some traders add a 0.25 to 0.5 ATR buffer to prevent being stopped out by normal volatility while maintaining a logical exit point.
Do gap and go strategies work on all stocks?
Gap and go strategies work best on stocks with adequate liquidity (500,000+ average daily volume), prices between $5 and $100, and clear news catalysts driving the gap. Illiquid stocks, penny stocks, and gaps without catalysts produce less reliable results.
What is the win rate for gap and go trading?
Win rates for gap and go trading vary based on entry criteria, stock selection, and exit rules. Our data across 600+ symbols shows average win rates between 52% and 53% by timeframe, while the overall 30-day realized target hit rate is 35.1% across 190,460 trades. Profitability depends on maintaining favorable risk-reward ratios, not just win rate alone.
Can I trade gap and go setups on ETFs like SPY and QQQ?
ETFs like SPY and QQQ can produce gap and go setups, though gaps on major indexes are typically smaller than individual stocks. Over the past 90 days, SPY opening range widths averaged $0.86 on tight days, $1.57 on medium days, and $3.30 on wide days. Index ETFs offer high liquidity and tight spreads. Review backtested performance specifically for index products since they behave differently than single stocks.
Getting Started with Gap and Go Trading
Gap and go trading combines the momentum of pre-market gaps with the confirmation of opening range breakouts. This approach provides defined entries, logical stop placement, and clear profit targets. The strategy works best when you apply strict filters and verify setups with backtested data.
Start by defining your gap criteria, preferred ORB timeframe, and position sizing rules. Test these parameters against historical data before trading real capital. Use a scanner to identify candidates efficiently rather than manually searching for setups.
The ORB Setups platform scans 600+ stocks and ETFs in real time, identifying gap and go opportunities with 2-second refresh rates. Each setup includes historical win rate and trade expectancy data from our database of 190,000+ tracked ORB trades. Backtest your gap and go parameters to find the settings that match your risk tolerance and trading goals.
Related Research
How VIX Affects Opening Range Breakout Win Rates: A Backtested Analysis
VIX 16-24 produces 58% ORB win rates vs 48% when VIX is below 13. Backtest of 47,000 opening range breakout…
Apr 21, 2026Opening Range Breakout Win Rate: What 150,000+ Trades Reveal About ORB Strategy Performance
ORB win rates range from 48% to 68% based on timeframe. Our analysis of 150,000+ trades reveals which setups have…
Apr 19, 2026Gap and Go Trading Strategy: How to Combine Gap Plays with Opening Range Breakouts
Gap and go setups combine pre-market gaps with opening range breakouts. Learn entry rules, stop placement, and backtested win rates…
Apr 18, 2026Trade with data.
Not hope.
600+ symbols. 2-second refresh. 150,000+ backtested setups. Win rates on every trade.
Start Your Edge