5-Minute vs 15-Minute vs 30-Minute Opening Range: Which Timeframe Has the Best Win Rate?
We backtested 1,178,668 ORB trades across 614 symbols. 5-min wins 53.78%, 15-min wins 50.97%, 30-min wins 49.38%. Full data breakdown inside.
The 5 minute opening range breakout strategy generates the most setups per session, but does it produce the best win rate? We backtested 1,178,668 ORB trades across 614 symbols and three timeframes to answer this question with data.
The opening range timeframe you choose directly affects your trade frequency, win rate, and profit potential. Each timeframe captures different market dynamics, and the “best” choice depends on your trading style, risk tolerance, and available screen time.
What Is the Opening Range and Why Does Timeframe Matter?
The opening range is the price range established during the first minutes of the trading session. This range forms a reference point for the rest of the day. A breakout occurs when price moves decisively above or below this range.
Three standard timeframes exist for opening range analysis: 5-minute, 15-minute, and 30-minute. Each captures a different slice of the morning session. The 5 minute opening range breakout strategy uses the narrowest window (average range width of $0.76), while the 30-minute range incorporates the full first half-hour and averages $1.04 in width.
Timeframe selection matters because it directly impacts three variables: the number of setups you see, the reliability of those setups, and the average move size following a breakout.
5-Minute Opening Range Breakout: Speed and Volume
The 5 minute opening range breakout captures the initial burst of activity at market open. This narrow window produces the tightest ranges, which means smaller stops and more frequent breakout signals throughout the session.
Our backtest data across 614 symbols shows the 5-minute ORB generated 337,988 breakout trades over 16 months. That’s roughly 3x more setups per day than the 30-minute ORB. However, this higher frequency comes with a trade-off: more false breakouts and lower win rates at certain target/stop combinations.
Strengths of the 5-Minute ORB
- Tighter stop-loss placement due to narrower ranges (avg $0.76 vs $1.04 for 30-min)
- More trading opportunities per session
- Faster confirmation of breakout direction
- Highest overall win rate at 53.78% across all rule combinations
Weaknesses of the 5-Minute ORB
- Higher susceptibility to false breakouts and whipsaws
- Requires faster decision-making and execution
- Opening volatility can trigger premature entries
- Only 3.34% of trades reach end-of-day without hitting target or stop – meaning fast resolution but less room for extended runners
The 5-minute ORB works best during high-volatility environments where initial momentum tends to persist. Earnings days, economic releases, and gap-up scenarios often favor this approach.
15-Minute Opening Range Breakout: The Middle Ground
The 15-minute opening range breakout balances trade frequency with signal reliability. This timeframe allows the initial opening chaos to settle while still capturing the morning session’s directional bias.
Over our 16-month dataset, the 15-minute ORB produced 385,180 trades with an overall 50.97% win rate. It sits squarely between the 5-minute and 30-minute timeframes in both frequency and reliability, with an average range width of $0.94.
Strengths of the 15-Minute ORB
- Filters out much of the opening noise and false moves
- Highest average P/L per trade at $0.0314 across all rule combinations
- Reasonable trade frequency for active day traders
- Balanced risk-to-reward profile
Weaknesses of the 15-Minute ORB
- Wider ranges mean larger stop-loss distances than the 5-minute approach
- Fewer setups compared to the 5-minute ORB
- May miss early momentum moves that occur in the first five minutes
The 15-minute ORB suits traders who want a systematic morning strategy without the rapid-fire decision-making the 5-minute window demands. With a Full Target / Full SL configuration, the 15-minute ORB achieves $0.044 average P/L – the highest expectancy of any single combination we tested.
30-Minute Opening Range Breakout: Patience and Precision
The 30-minute opening range breakout uses the full first half-hour to establish the day’s key levels. This approach generated 455,500 trades in our dataset – the highest raw count because the wider range captures more symbols per day – but with a 49.38% aggregate win rate.
Waiting 30 minutes allows the market to digest overnight news, earnings announcements, and economic data. By the time the range forms, institutional positioning is often more visible in the price action. However, 12.76% of 30-minute ORB trades reach end-of-day without resolution, compared to just 3.34% for the 5-minute ORB.
Strengths of the 30-Minute ORB
- Clearest institutional activity signals
- Reduced impact of opening volatility and fake-outs
- Better suited for traders with limited screen time
- Highest total P/L at $13,270.96 across our dataset despite lower win rate
Weaknesses of the 30-Minute ORB
- Widest ranges (avg $1.04) require larger stop-losses and position sizing adjustments
- Lowest win rate of the three timeframes at 49.38%
- May miss significant morning moves that occur before the range closes
- Higher percentage of trades expire at end-of-day without hitting target or stop
The 30-minute ORB appeals to traders who prioritize total dollar return over win rate. Despite winning less than half its trades, the 30-minute timeframe produced the highest cumulative P/L in our backtest due to larger average winning trades.
Opening Range Breakout Win Rate Comparison: 1.17 Million Trades Analyzed
We ran our backtest across all 614 symbols in the ORB Setups scanner, covering December 2024 through March 2026 – 311 trading days of 1-minute candle data. The chart below shows the aggregate win rate for each timeframe across all target/stop rule combinations.
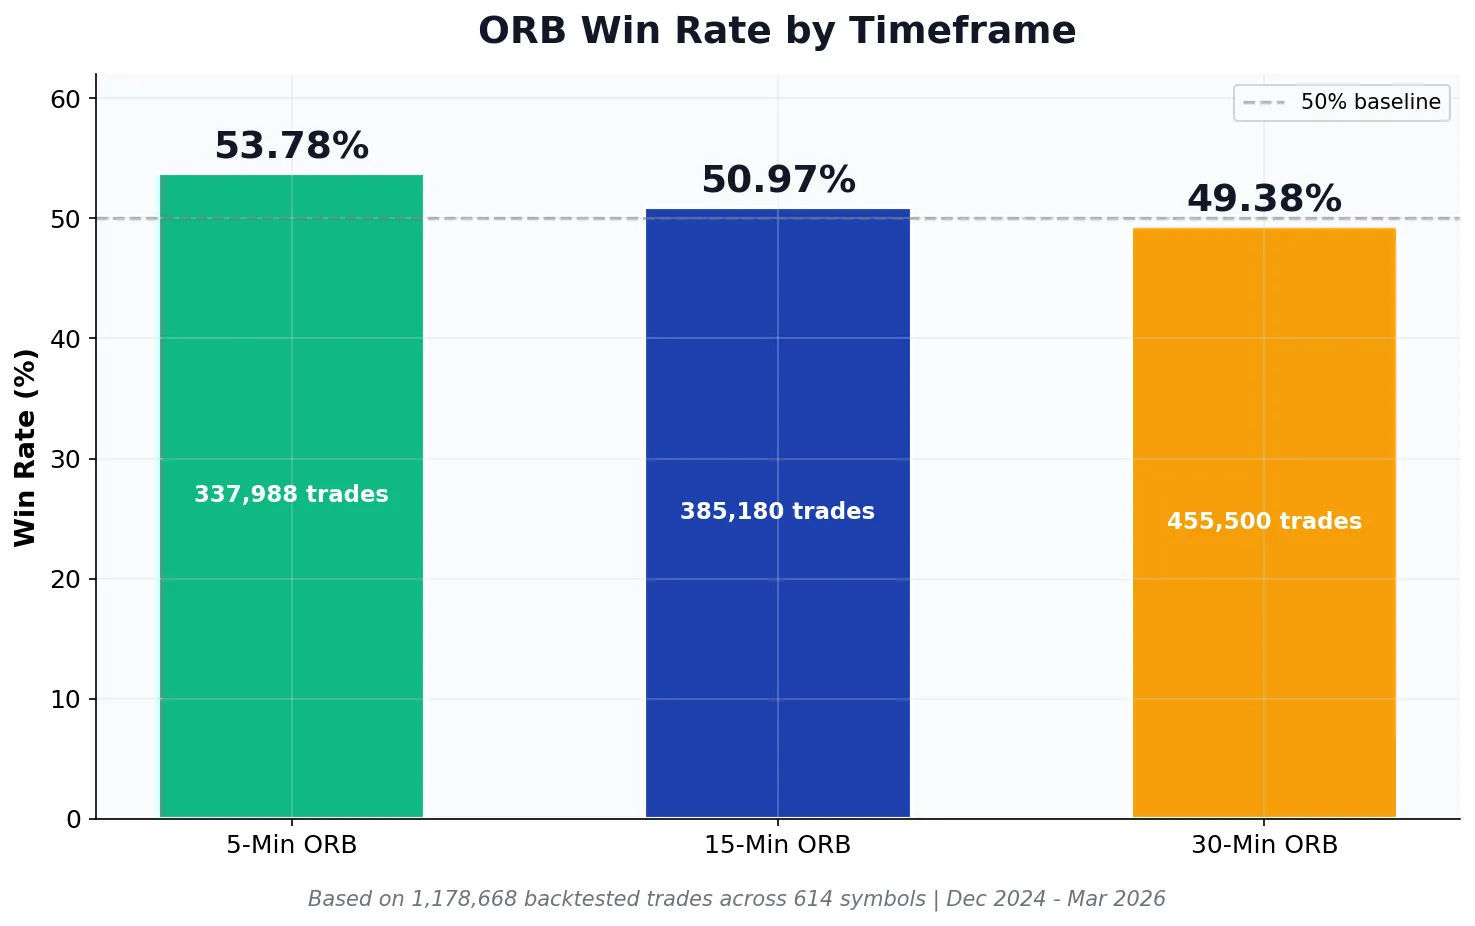
The result challenges a common assumption: the 5-minute ORB actually produces the highest overall win rate at 53.78%, not the 30-minute. The conventional wisdom that “longer timeframes are more reliable” doesn’t hold when measured across a large sample. The 5-minute ORB’s tighter ranges and faster resolution outweigh its higher noise level when aggregated across all rule combinations.
How Target and Stop Rules Change Everything
Win rate alone is misleading. The specific target and stop loss rules you apply transform these numbers dramatically. We tested four combinations for each timeframe: Half Target with Full Stop, Half Target with Half Stop, Full Target with Full SL, and Full Target with Half Stop. The differences are massive.
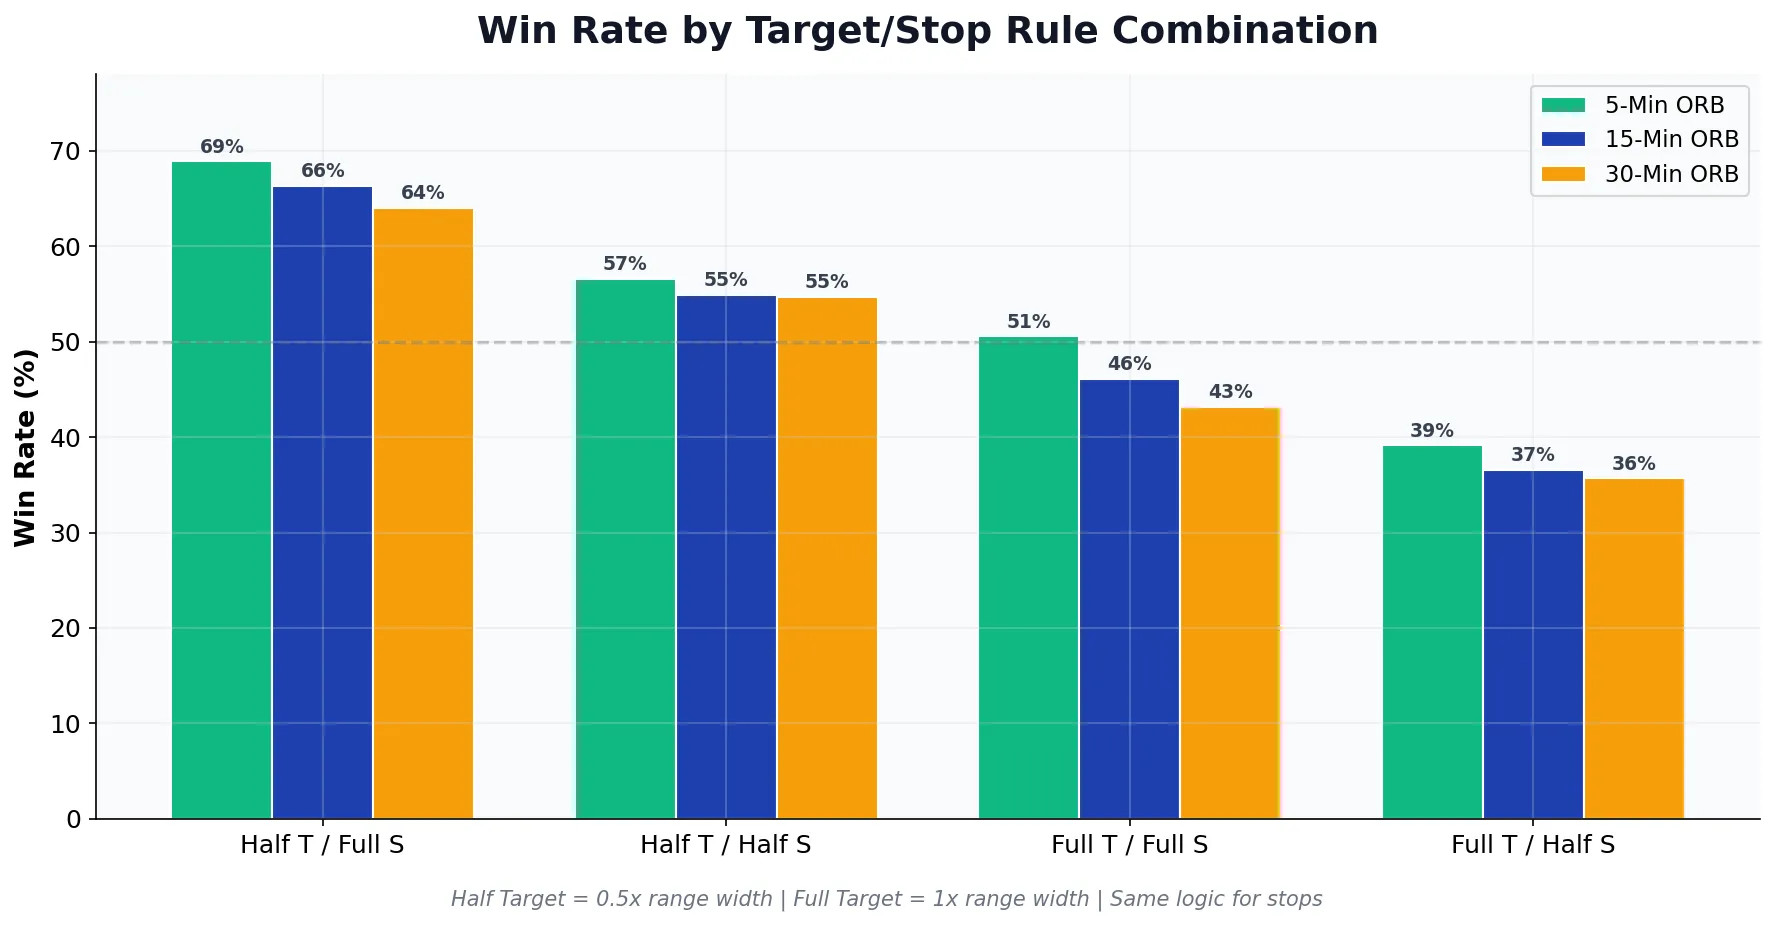
The Half Target / Full SL combination produces the highest win rates across all timeframes: 68.87% for 5-minute, 66.34% for 15-minute, and 63.99% for 30-minute. This makes intuitive sense – you’re taking profit at half the range width while giving the trade a full range to work against you. You win more often but capture smaller gains per win.
Conversely, the Full Target / Half Stop combination (largest target, tightest stop) produces the lowest win rates – 39.12% for 5-minute, 36.54% for 15-minute, and 35.66% for 30-minute. But those wins are significantly larger, which is why expectancy matters more than win rate.
Opening Range Breakout Expectancy: Beyond Win Rate
Win rate alone does not determine profitability. A strategy with a 40% win rate can outperform one with a 60% win rate if the winners are significantly larger than the losers.
The 15-minute ORB with Full Target / Full SL produces the highest average P/L at $0.044 per trade – despite a 46.12% win rate that’s below the breakeven line. The winning trades are large enough to more than offset the losers. Compare that to the 5-minute Half Target / Full SL at 68.87% win rate but only $0.018 average P/L – you win more often but each win is smaller.
This is the core trade-off every ORB trader must navigate: higher win rates with smaller gains, or lower win rates with larger gains. The “right” choice depends on your psychological tolerance for losing streaks and your account size.
Monthly Win Rate Trends: Seasonal Patterns in ORB Performance
ORB win rates are not static. They fluctuate significantly based on market conditions, volatility regimes, and seasonal patterns. The chart below tracks monthly win rates for all three timeframes over our full 16-month dataset using the Full Target / Full SL rule.
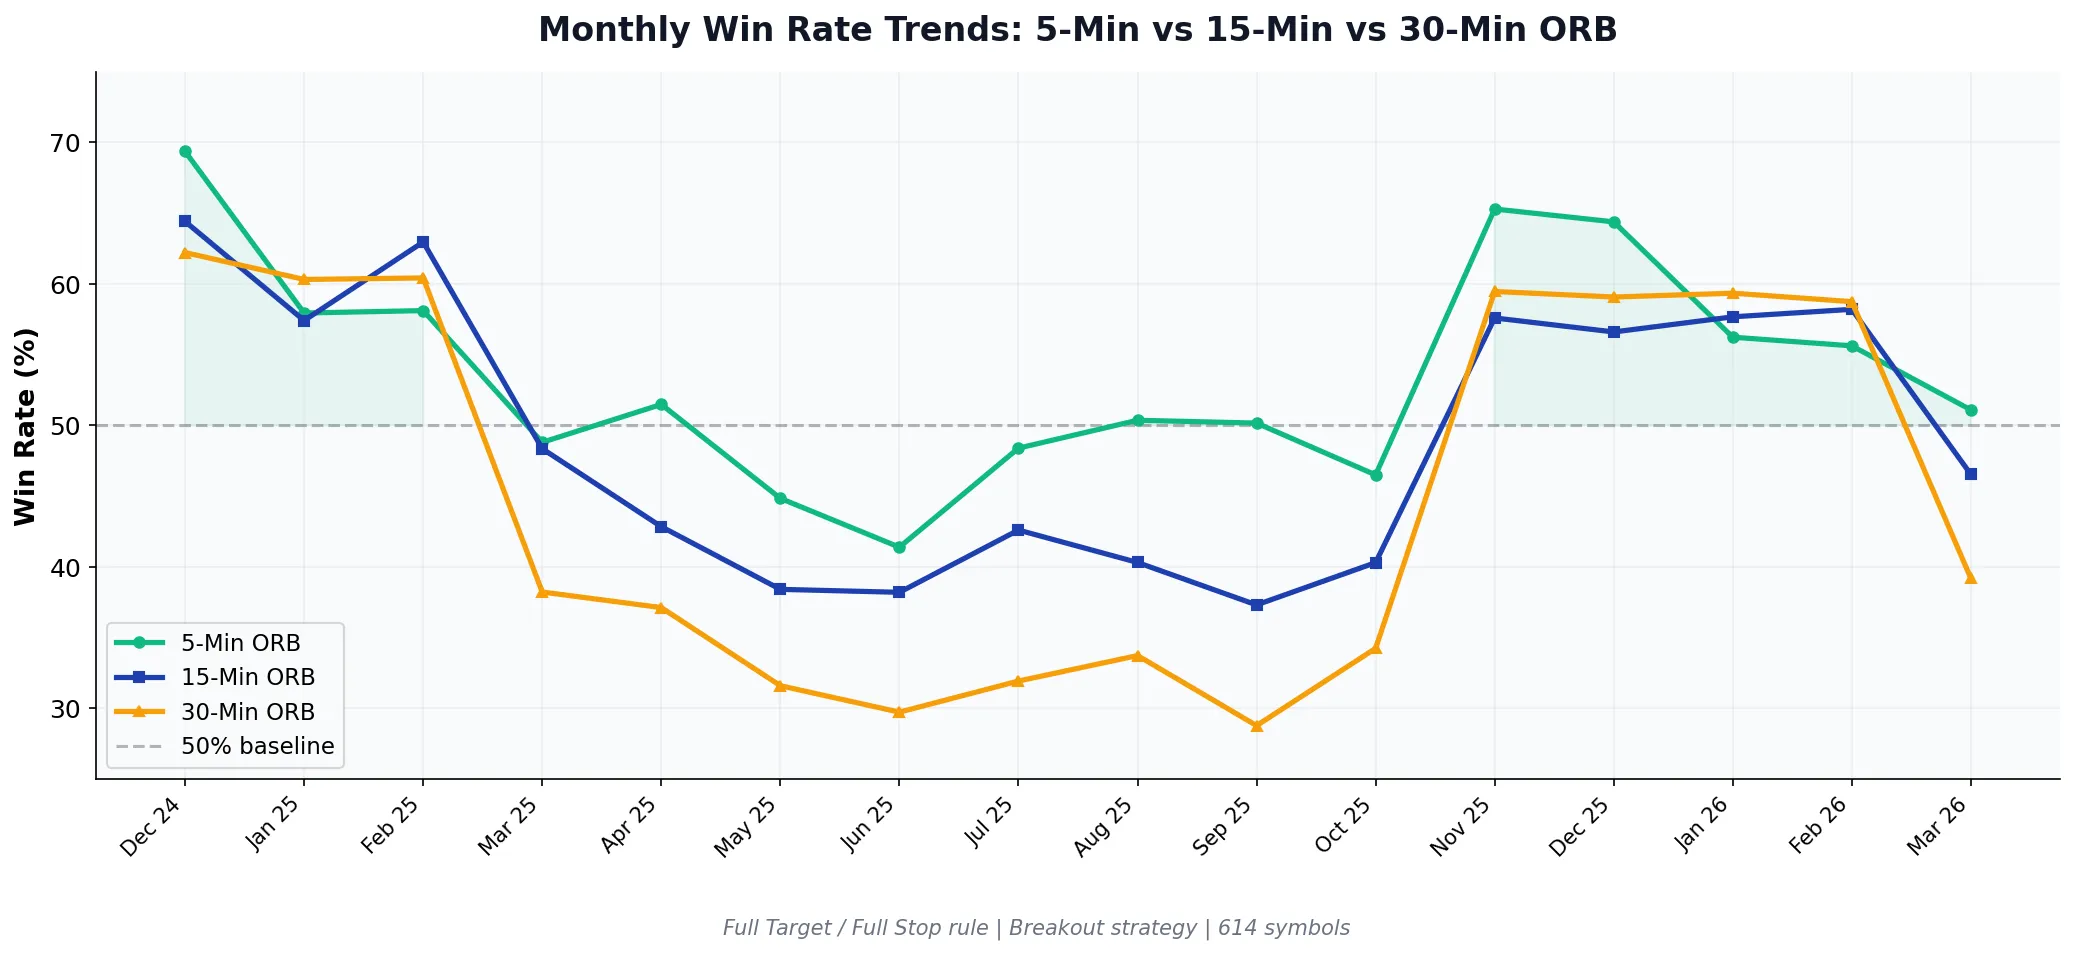
Several patterns emerge from this data. The 5-minute ORB is the most stable – it rarely dips below 41% or rises above 69%. The 30-minute ORB shows the most extreme swings, dropping below 30% during difficult months (June 2025, September 2025) but surging above 60% during favorable conditions.
All three timeframes show a notable dip from March through October 2025, followed by recovery in November 2025 onward. This correlates with the broader market volatility cycle – ORB strategies tend to perform better during trending environments and struggle during range-bound, choppy markets.
Which Opening Range Breakout Timeframe Should You Trade?
The optimal ORB timeframe depends on your individual trading profile. No single timeframe performs best in all conditions or for all traders.
Choose the 5-Minute ORB If:
- You can dedicate full attention to the morning session
- You prefer higher trade frequency and can manage multiple positions
- You want the highest aggregate win rate (53.78%)
- You trade high-momentum, news-driven setups
Choose the 15-Minute ORB If:
- You want the best risk-adjusted returns (highest average P/L at $0.031)
- You can monitor the market for the first 30-60 minutes
- You prefer a systematic approach with moderate activity
- You want a balance between win rate and profitability per trade
Choose the 30-Minute ORB If:
- You prioritize total cumulative P/L ($13,270 in our backtest – highest of the three)
- You have limited time and need to be selective
- You prefer larger moves with clearer institutional participation
- You can tolerate a sub-50% win rate for larger average gains
ORB Win Rate by Symbol: Not All Stocks Are Equal
Aggregate timeframe stats hide a critical variable: individual symbol behavior. The heatmap below shows win rates for the 10 most actively traded symbols in our dataset, broken out by timeframe using the Full Target / Full SL rule.
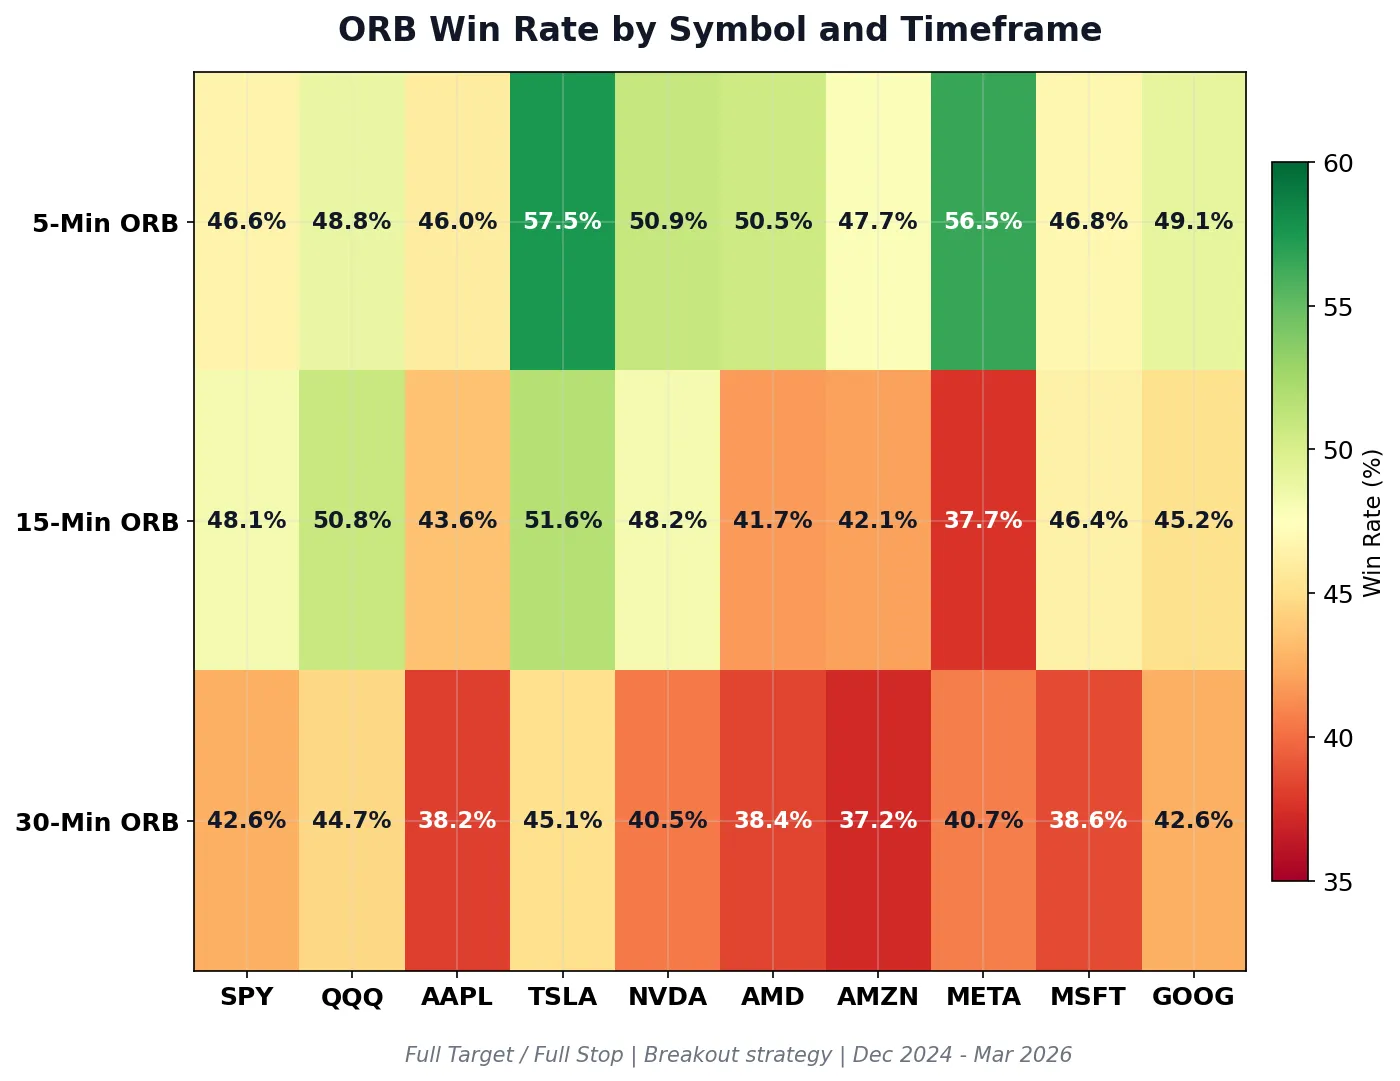
TSLA stands out as the strongest ORB performer across all three timeframes, with a 57.46% win rate on the 5-minute and the highest average P/L of any symbol at $0.996 per trade on the 30-minute. This makes sense – Tesla’s high beta and retail trader participation create the momentum ORB strategies need.
META shows an unusual pattern: strong on the 5-minute (56.54%) but weak on the 15-minute (37.67%), suggesting META’s opening range dynamics change significantly depending on the timeframe window. SPY and QQQ – the most liquid instruments – hover near the 50% mark across all timeframes, which is expected for highly efficient markets.
The takeaway: backtest the specific symbols you trade. Aggregate timeframe stats can mislead you if the stocks in your watchlist behave differently from the universe average.
Long vs Short: Does Direction Matter for Opening Range Breakouts?
Does it matter whether you trade long or short ORB breakouts? The data shows a consistent but modest directional bias across all three timeframes.
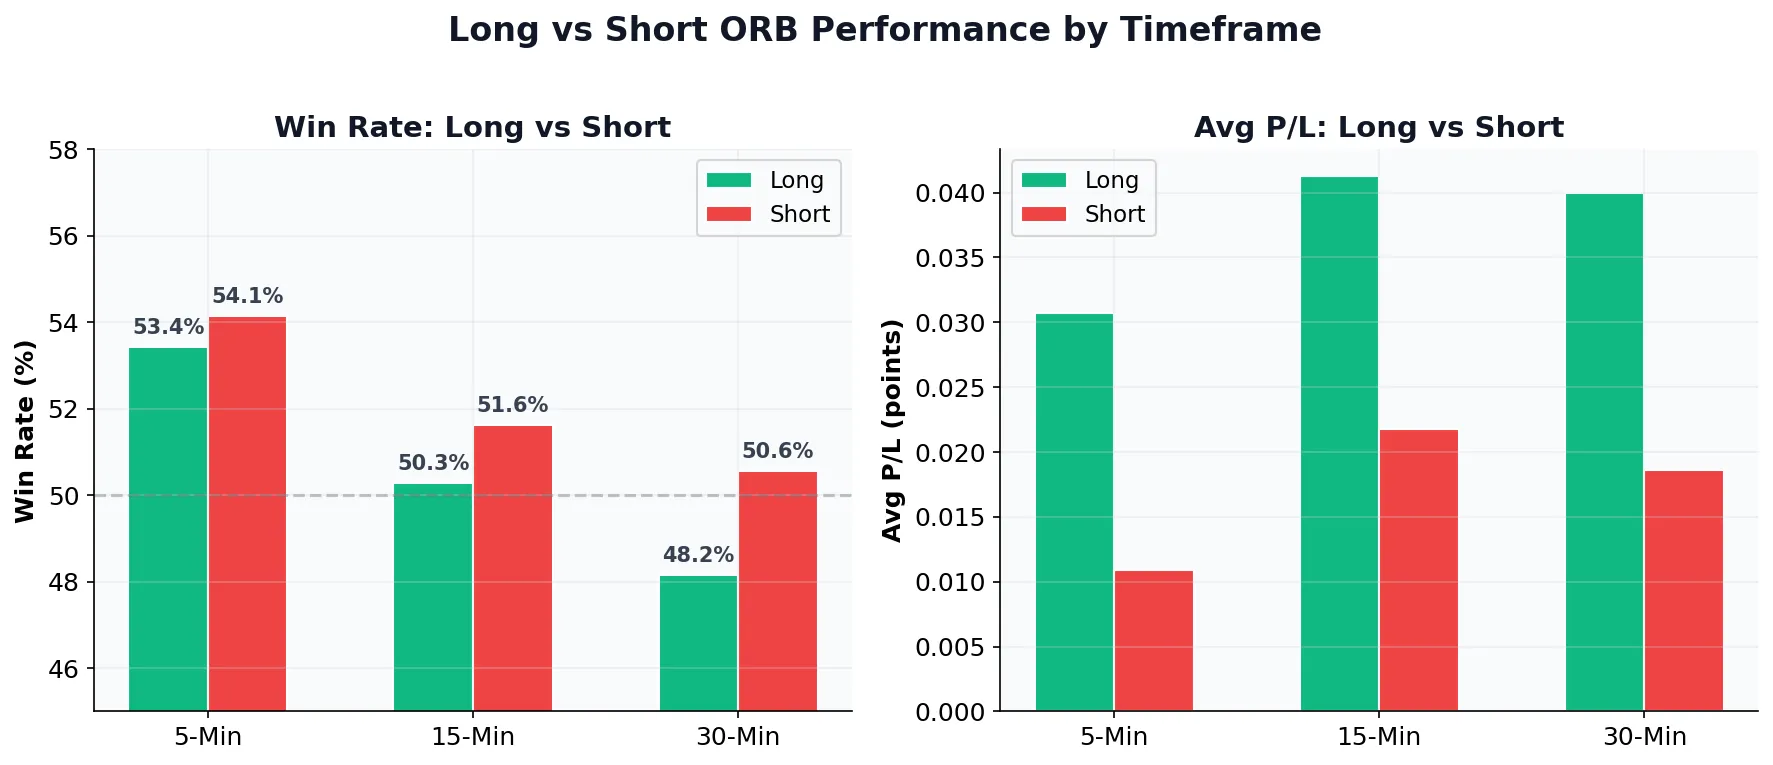
Short breakouts win more often – 54.14% vs 53.42% on the 5-minute, 51.63% vs 50.28% on the 15-minute, and 50.56% vs 48.16% on the 30-minute. But long breakouts produce significantly higher average P/L: $0.031 vs $0.011 on the 5-minute, and $0.041 vs $0.022 on the 15-minute.
This asymmetry reflects a fundamental market characteristic: stocks spend more time going up than down (long-term upward drift), but they fall faster than they rise. Short ORB breakouts resolve quickly with smaller gains, while long breakouts can produce extended runners.
Practical Implementation Tips
Regardless of which timeframe you choose, these principles apply to all ORB strategies:
- Size positions based on range width: Use the opening range as your risk unit. A wider 30-minute range requires smaller share counts than a tight 5-minute range to maintain consistent dollar risk
- Respect the range boundaries: Do not anticipate breakouts before they occur
- Monitor volume: Valid breakouts typically show increasing volume at the break
- Use the first pullback: If you miss the initial breakout, the first pullback to the range often provides a second entry with better risk/reward
- Backtest your specific watchlist: As the symbol heatmap shows, aggregate stats can be misleading for individual tickers
Position sizing is critical for ORB trading. Our Trade Cards calculate these adjustments automatically based on each setup’s specific range width and your defined risk parameters.
Backtesting Your Preferred Opening Range Breakout Timeframe
Before committing capital to any ORB timeframe, backtest it across relevant symbols and market conditions. Historical performance does not guarantee future results, but backtesting reveals whether a strategy has shown consistent edge over a meaningful sample.
Our backtester analyzes 150,000+ historical ORB setups with 1-minute granularity. You can filter by timeframe, symbol, direction, gap size, and volume characteristics to understand how each approach performs in specific conditions.
We recommend evaluating at least 100 trades per configuration before drawing conclusions. The monthly trends chart above shows that any single month can deviate significantly from long-term averages – a 30-day sample is too small to judge a strategy’s edge.
Frequently Asked Questions
Frequently Asked Questions
Related Research
How VIX Affects Opening Range Breakout Win Rates: A Backtested Analysis
VIX 16-24 produces 58% ORB win rates vs 48% when VIX is below 13. Backtest of 47,000 opening range breakout…
Apr 21, 2026Opening Range Breakout Win Rate: What 150,000+ Trades Reveal About ORB Strategy Performance
ORB win rates range from 48% to 68% based on timeframe. Our analysis of 150,000+ trades reveals which setups have…
Apr 19, 2026Gap and Go Trading Strategy: How to Combine Gap Plays with Opening Range Breakouts
Gap and go setups combine pre-market gaps with opening range breakouts. Learn entry rules, stop placement, and backtested win rates…
Apr 18, 2026Trade with data.
Not hope.
600+ symbols. 2-second refresh. 150,000+ backtested setups. Win rates on every trade.
Start Your Edge