Reading Scanner Results
Reading Scanner Results
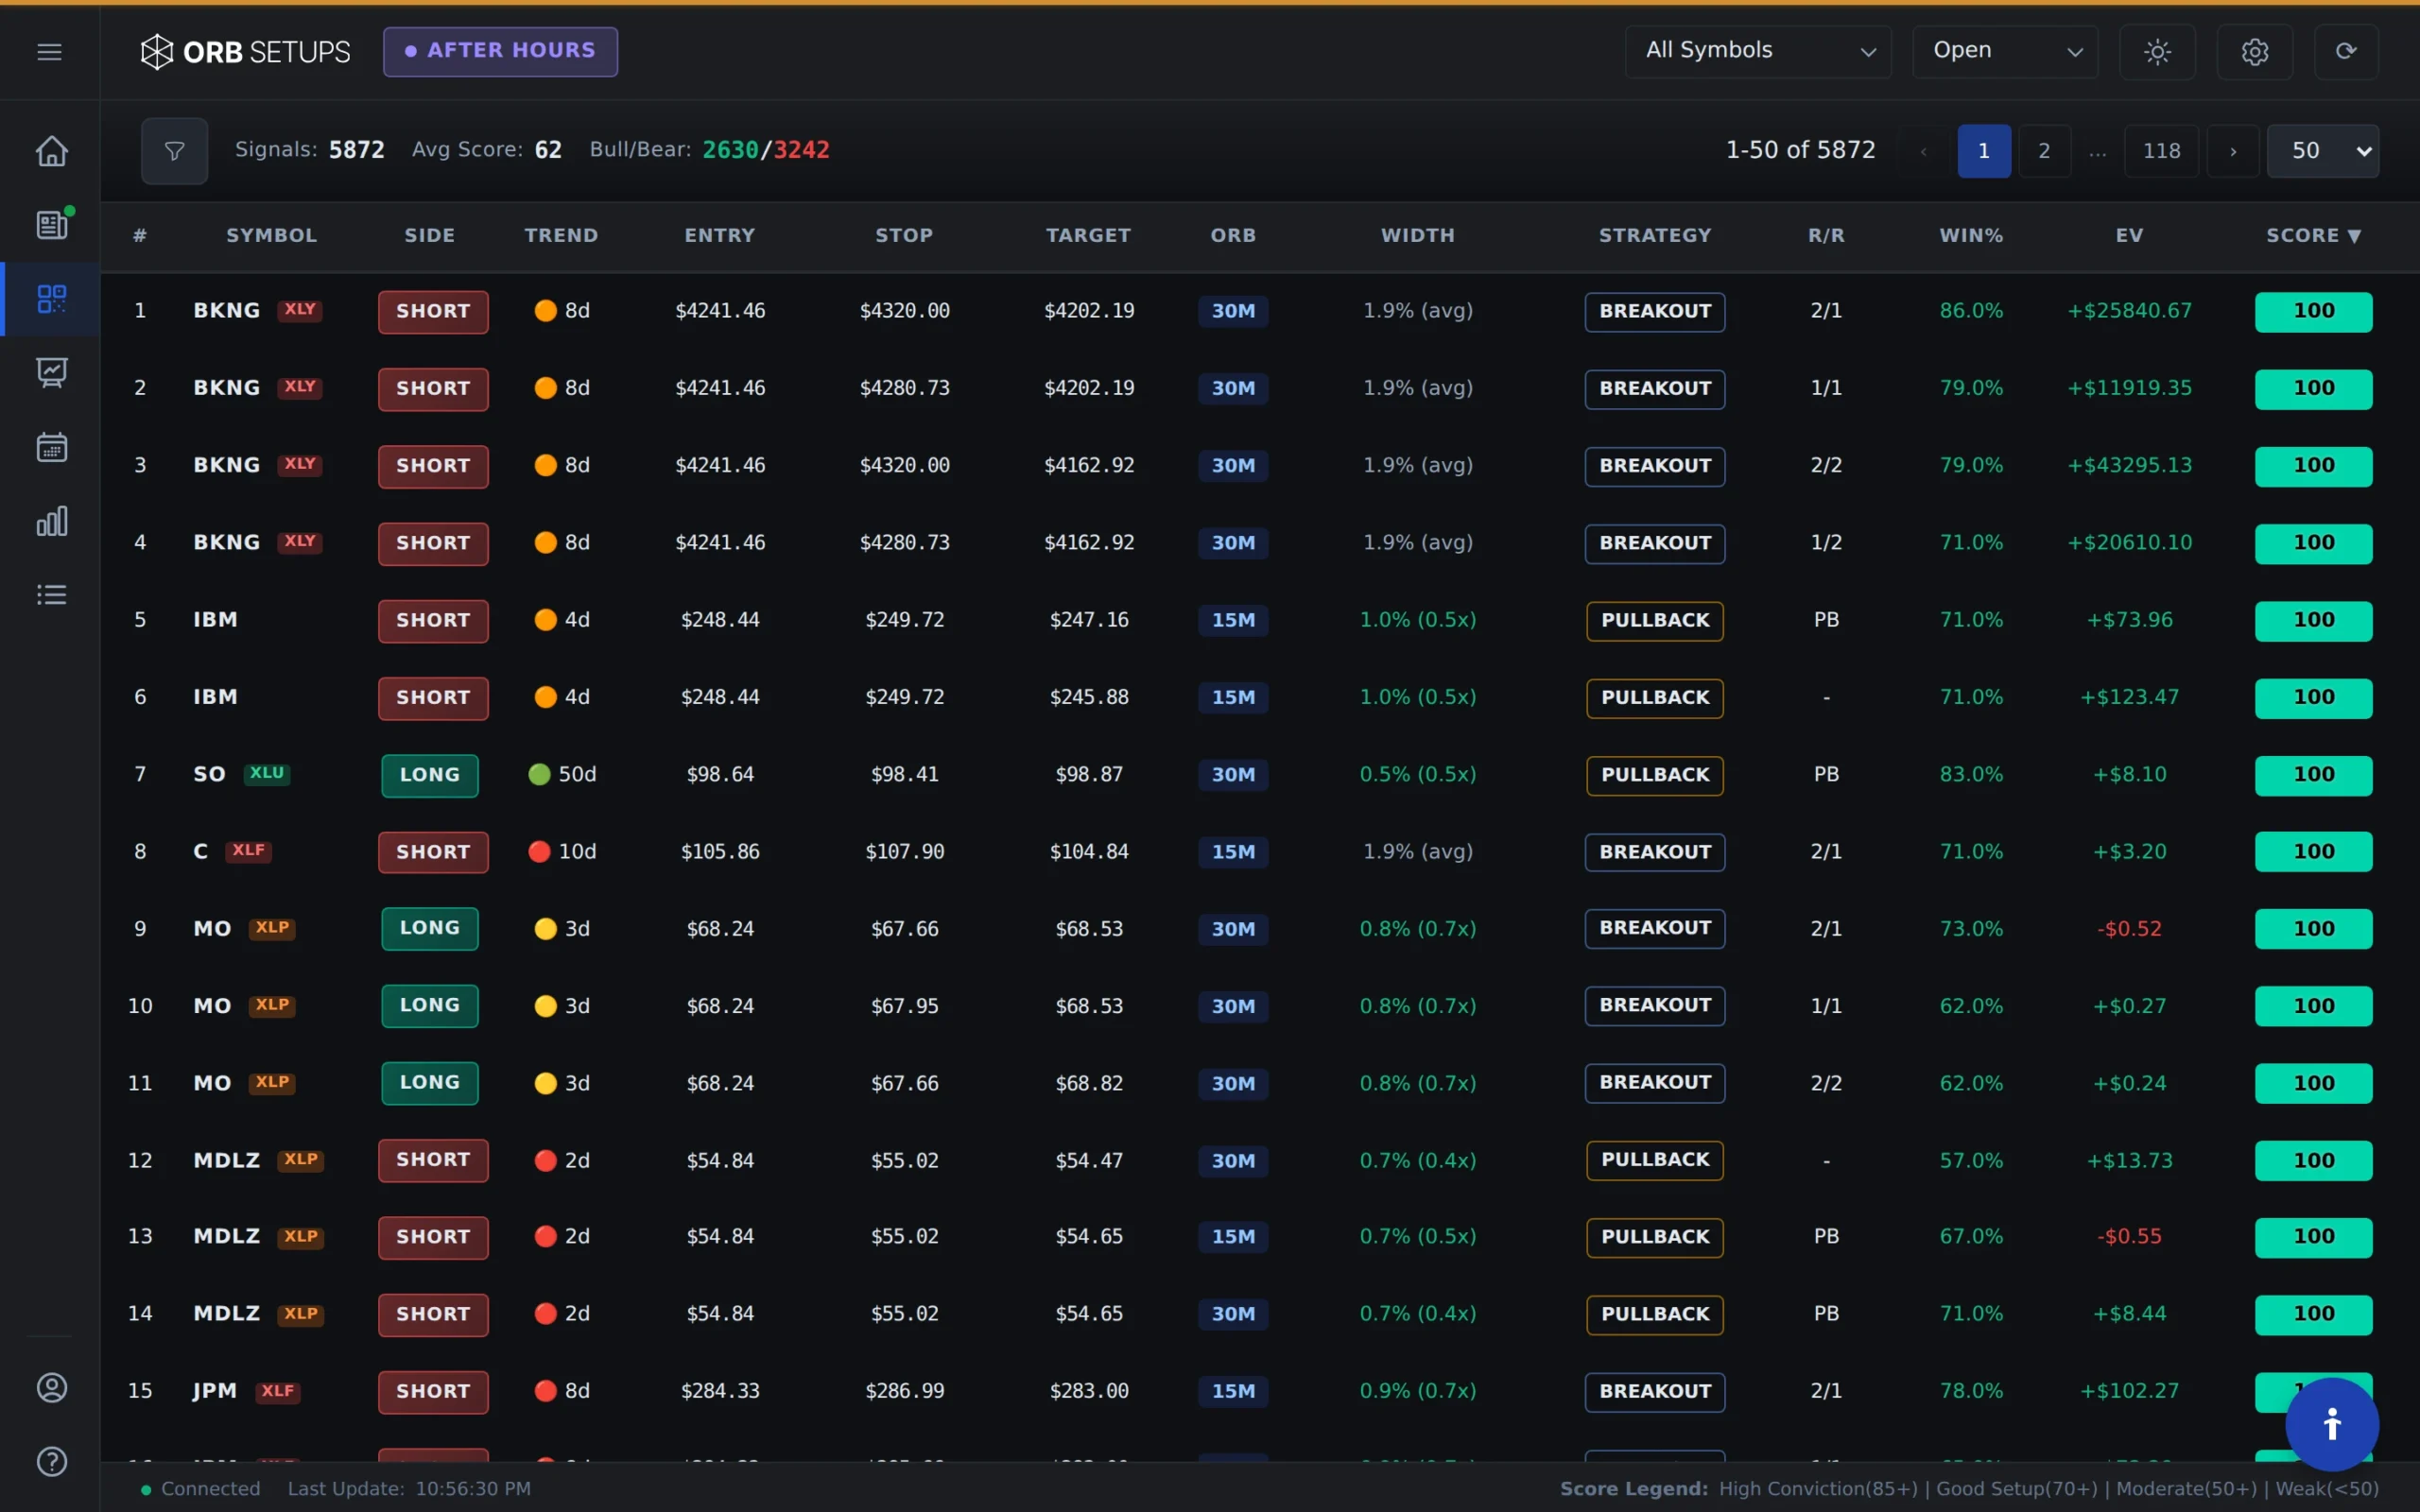
The ORB Setups Live Scanner monitors 600+ stocks and ETFs in real-time, refreshing every 2 seconds to catch opening range breakouts as they happen. This guide walks you through each element of the scanner so you can quickly identify and evaluate setups.
Understanding the Scanner Table Columns
Each row in the scanner represents a symbol that has triggered an opening range breakout. Here’s what each column tells you:
- Symbol: The stock or ETF that triggered the breakout. Click any symbol to view its full Trade Card with entry, target, and stop levels.
- Range: The width of the opening range in dollars. Tighter ranges often expand as the session progresses, which can lead to larger moves.
- Position: Whether the setup is a long (breakout above the range) or short (breakdown below the range). All backtest stats shown are filtered to match this direction.
- Expectancy: The average dollar gain or loss per trade over the trailing 90 days. Positive expectancy means the setup has historically been profitable.
- Trailing P/L: Total profit or loss from all trades of this setup type over the past 90 days. This gives you a quick read on recent performance.
- Win Rate: The percentage of winning trades for this symbol and direction over the trailing 90 days. Based on 1.6M+ backtested trades across 150,000+ historical setups.
- Win/Loss: The actual count of winners versus losers. The first number is wins, the second is losses. A ratio of 8/2 means 8 winners and 2 losers.
- Risk/Reward: The ratio of risk to potential reward. A 1:2 ratio means you’re risking 1 unit to potentially gain 2.
Expanding Rows for Trade Details
Click any row to expand it and view the complete Trade Card. The expanded view shows you everything you need to execute the trade:
- Entry Price: The exact price level where the breakout triggered
- Target Price: The calculated profit target based on the opening range width
- Stop Price: The suggested stop loss level to manage risk
- Entry Time: When the breakout occurred
- Exit Time: When the trade closed (if applicable)
- Live P/L: Current profit or loss if the trade is still open
Tip: Look for setups where the current price has pulled back below the breakout level while the trade is still open. This can offer a better entry than chasing the initial breakout, especially on setups with strong backtest data.

Filtering and Sorting Results
The scanner lets you filter results to focus on what matters most to your trading:
- Open Trades Only: See active setups that are still in play. Best for finding entries during market hours.
- Closed Trades Only: Review completed trades from the session. Useful for end-of-day analysis and learning from the day’s action.
- All Trades: View both open and closed setups together for a complete picture of the day.
You can also sort by any column. Sort by win rate to find the highest-probability setups, or by expectancy to prioritize trades with the best historical edge.
Choosing Your Timeframe
The scanner supports three opening range timeframes:
- 5-Minute ORB: Fastest signals, best for scalping and quick momentum plays
- 15-Minute ORB: Balanced approach with more confirmation before the breakout triggers
- 30-Minute ORB: Most reliable levels, ideal for traders who want to avoid early false breakouts
Each timeframe has its own backtest data, so the stats you see are specific to the range duration you’ve selected.
Using Scanner Data for Trade Decisions
The scanner gives you the data. Here’s how to use it:
- Prioritize positive expectancy: Focus on setups where the trailing 90-day expectancy is positive. This means the setup has paid traders over time.
- Check sample size: A 90% win rate on 2 trades is less meaningful than a 65% win rate on 50 trades. Use the Win/Loss column to verify you have enough data.
- Match risk/reward to your style: Some traders prefer lower win rates with higher reward ratios. Others want high win rates even with smaller gains. The scanner shows you both.
- Combine with your analysis: The scanner provides historical context. Pair it with your own chart reading, sector analysis, or market conditions for better results.
With 600+ symbols updating every 2 seconds and backtest data from 150,000+ historical setups, the scanner helps you find and evaluate ORB opportunities faster than manual scanning ever could.