Setting up the Scanner
What is the Live Scanner?
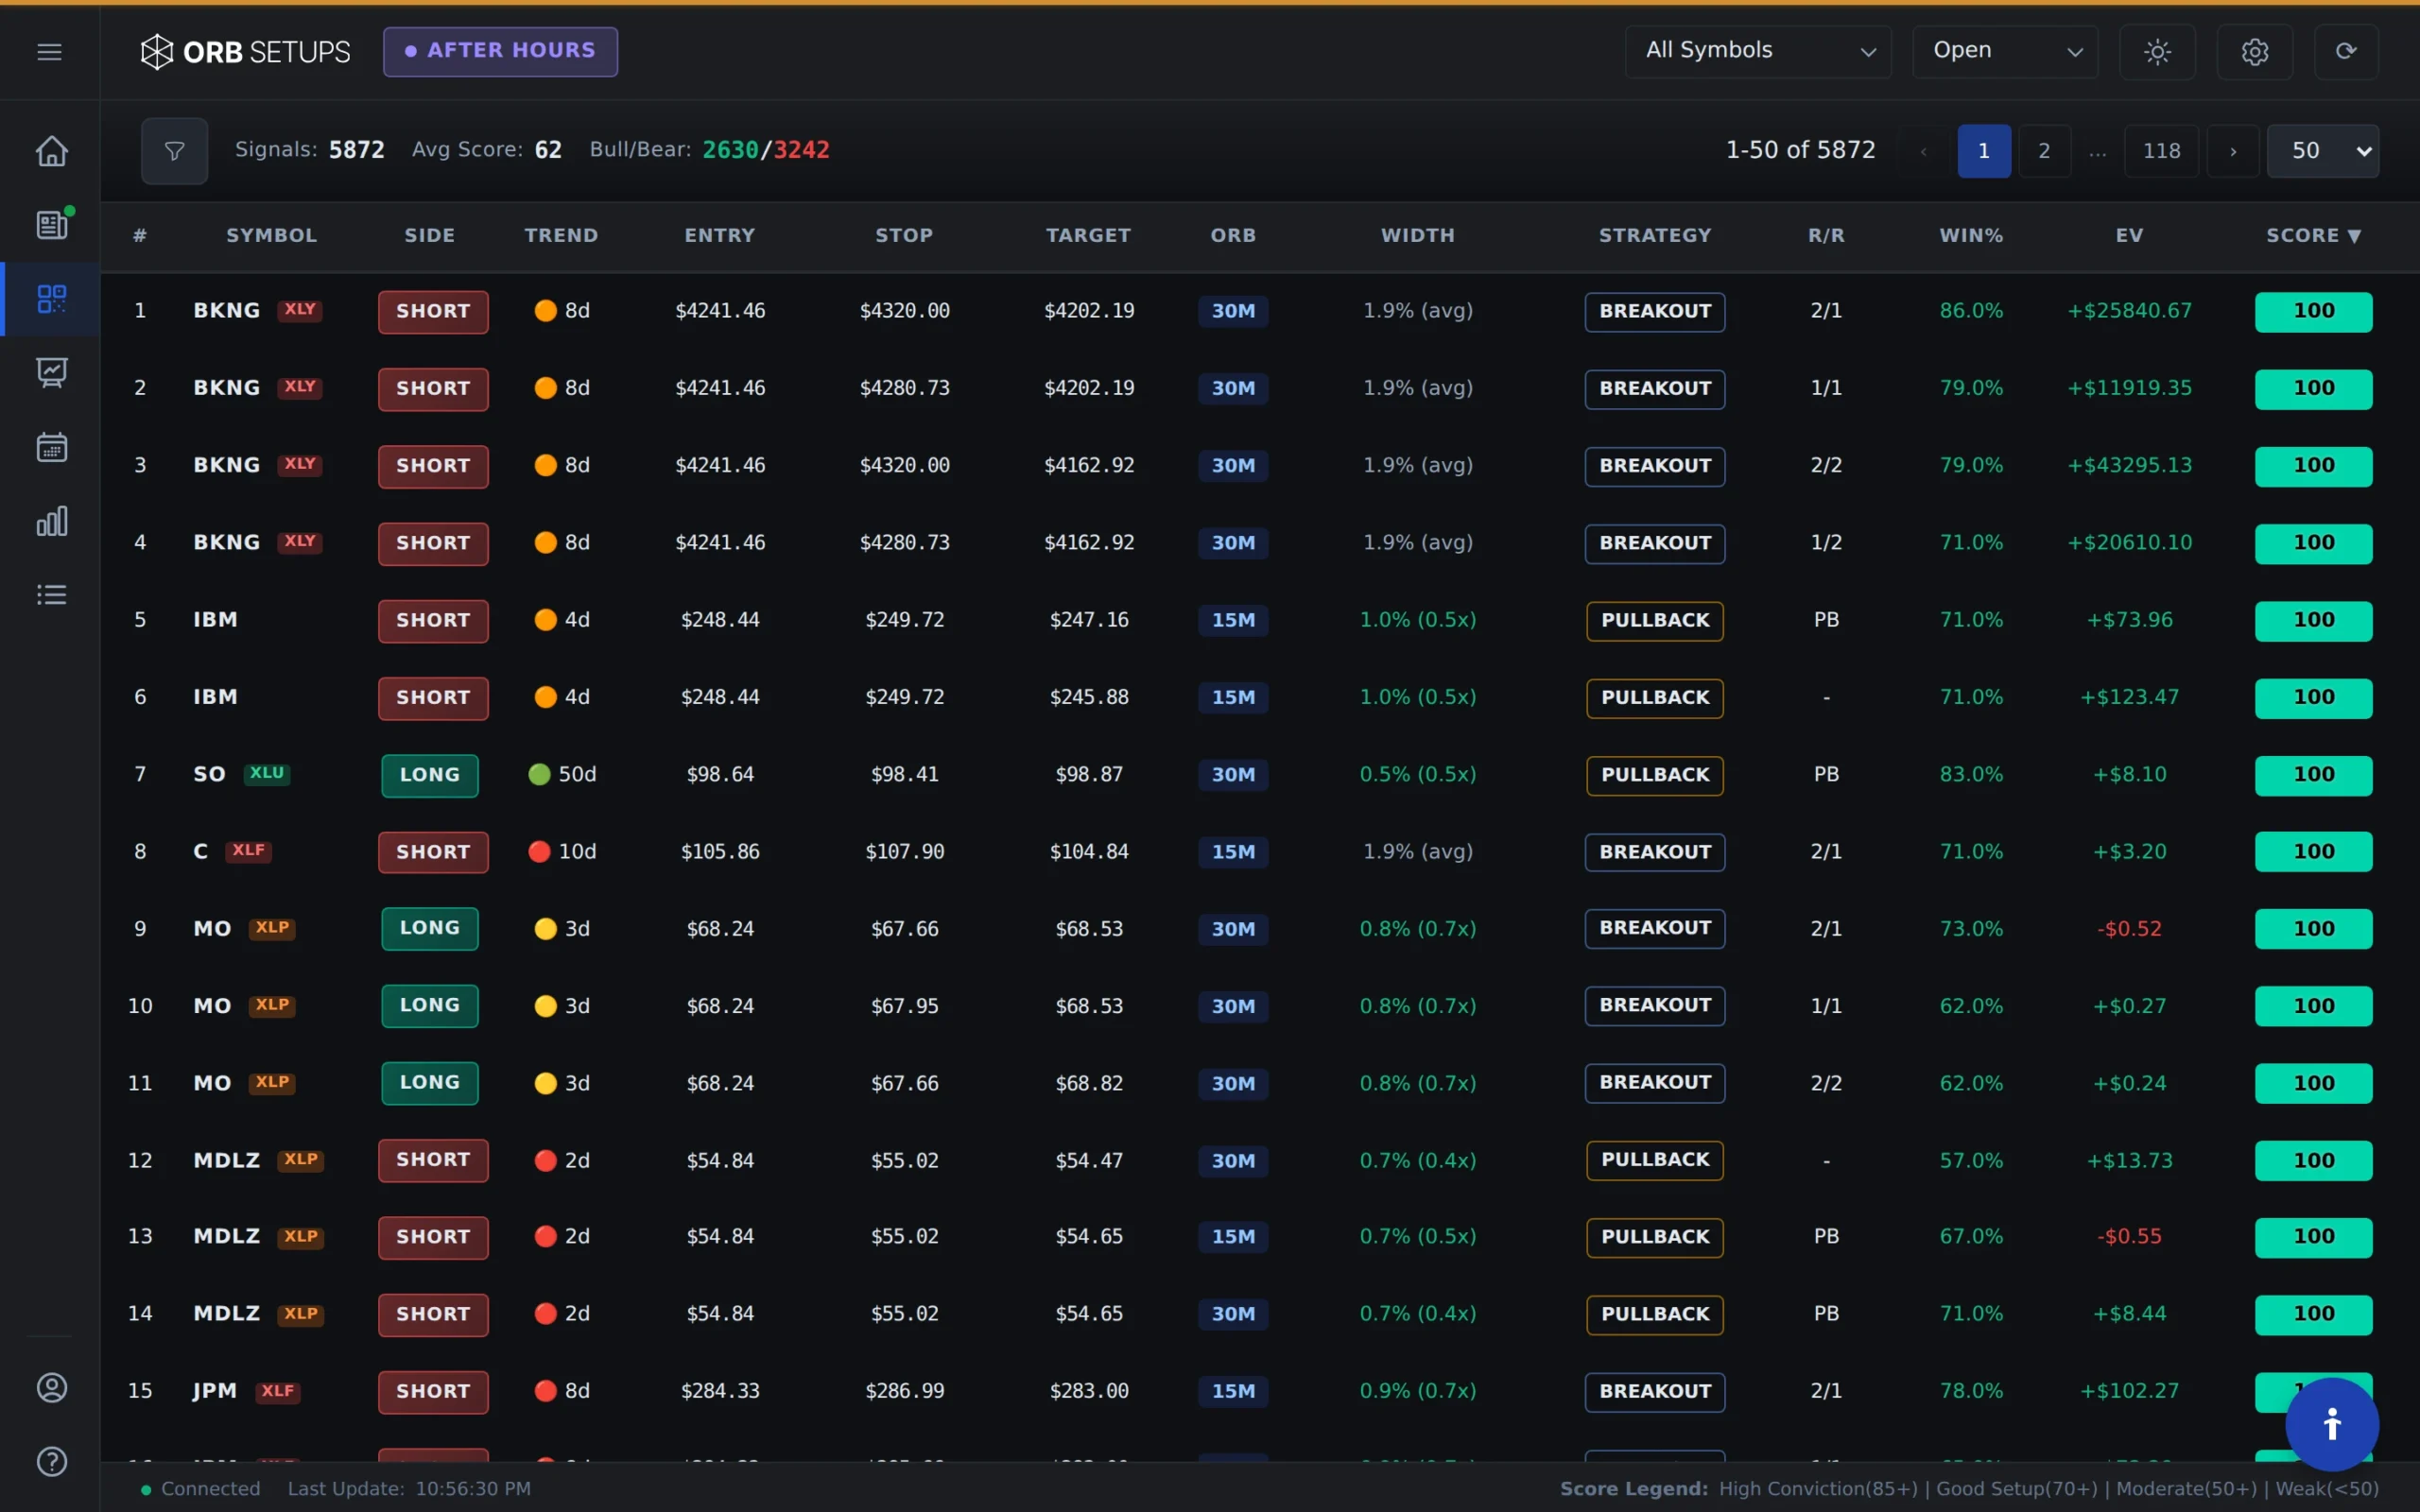
The Live Scanner finds Opening Range Breakout setups across 600+ stocks and ETFs in real time. It scans every 2 seconds, filtering results based on your preferred win rate, expectancy, and P/L thresholds. Each setup includes backtested performance data from 150,000+ historical trades so you can evaluate the edge before entering a position.
Accessing the Scanner
Log in to your ORB Setups account and navigate to the Live Scanner page. The scanner runs automatically during market hours and updates every 2 seconds as new breakouts occur.
Configuring Your Filters
The scanner includes several filters to narrow down results to setups that match your trading criteria. Here is how to configure each one:
1. Select Your Symbol List
Choose which symbols to scan. You can scan the full universe of 600+ symbols or select a custom watchlist you have created.
2. Set Your ORB Timeframe
Choose from three opening range timeframes:
- 5-minute ORB: Scans for breakouts occurring after the first 5 minutes of trading (9:35 AM EST onward)
- 15-minute ORB: Scans for breakouts occurring after the first 15 minutes (9:45 AM EST onward)
- 30-minute ORB: Scans for breakouts occurring after the first 30 minutes (10:00 AM EST onward)
3. Filter by Backtest Performance
Use these filters to show only setups with historical edge:
- Win Rate: Minimum historical win rate for the setup (e.g., 60% or higher)
- Expectancy: Average expected return per trade based on backtested results
- Trailing P/L: Cumulative profit/loss from all historical instances of similar setups
4. Choose Breakout Direction
Filter results by trade direction:
- Long: Show only bullish breakouts above the opening range high
- Short: Show only bearish breakouts below the opening range low
- Both: Show all breakouts regardless of direction
5. Set Target and Stop Parameters
Select your preferred risk/reward structure:
- Target: Choose half target (0.5x the opening range) or full target (1x the opening range)
- Stop: Choose half stop or full stop based on the opening range size
6. Sort Your Results
Organize the scanner output by:
- Symbol name
- Opening range size
- Win rate
- Expectancy
- Trailing P/L
- Risk/reward ratio
Working with Scanner Results
Once your filters are set, the scanner displays all setups that match your criteria. Scroll through the list to review each opportunity. The tighter your filters, the fewer setups you will see.
If you are not seeing enough setups on low volatility days, try lowering your win rate or expectancy thresholds. If you are seeing too many setups and want to focus on higher-probability trades, increase those same filters.
To reset all filters to their default values, refresh the page.
Tips for Using the Scanner
- Start with wider filters to understand what setups are available, then tighten criteria as needed
- Watch the 2-second refresh during the opening range period when new breakouts are forming
- Use custom watchlists if you prefer to focus on specific sectors or a curated set of symbols
- Check backtested stats on each Trade Card before entering a position
Understanding the Scan Timing
The scanner begins searching for breakouts after your selected opening range period closes:
- 5-minute ORB: Breakouts detected starting at 9:35 AM EST
- 15-minute ORB: Breakouts detected starting at 9:45 AM EST
- 30-minute ORB: Breakouts detected starting at 10:00 AM EST
The scanner continues running throughout the trading session, with each result showing real-time price data alongside historical performance from 1.6M+ backtested trades.