Analyzing Backtest Results
How to Read Your Backtest Report
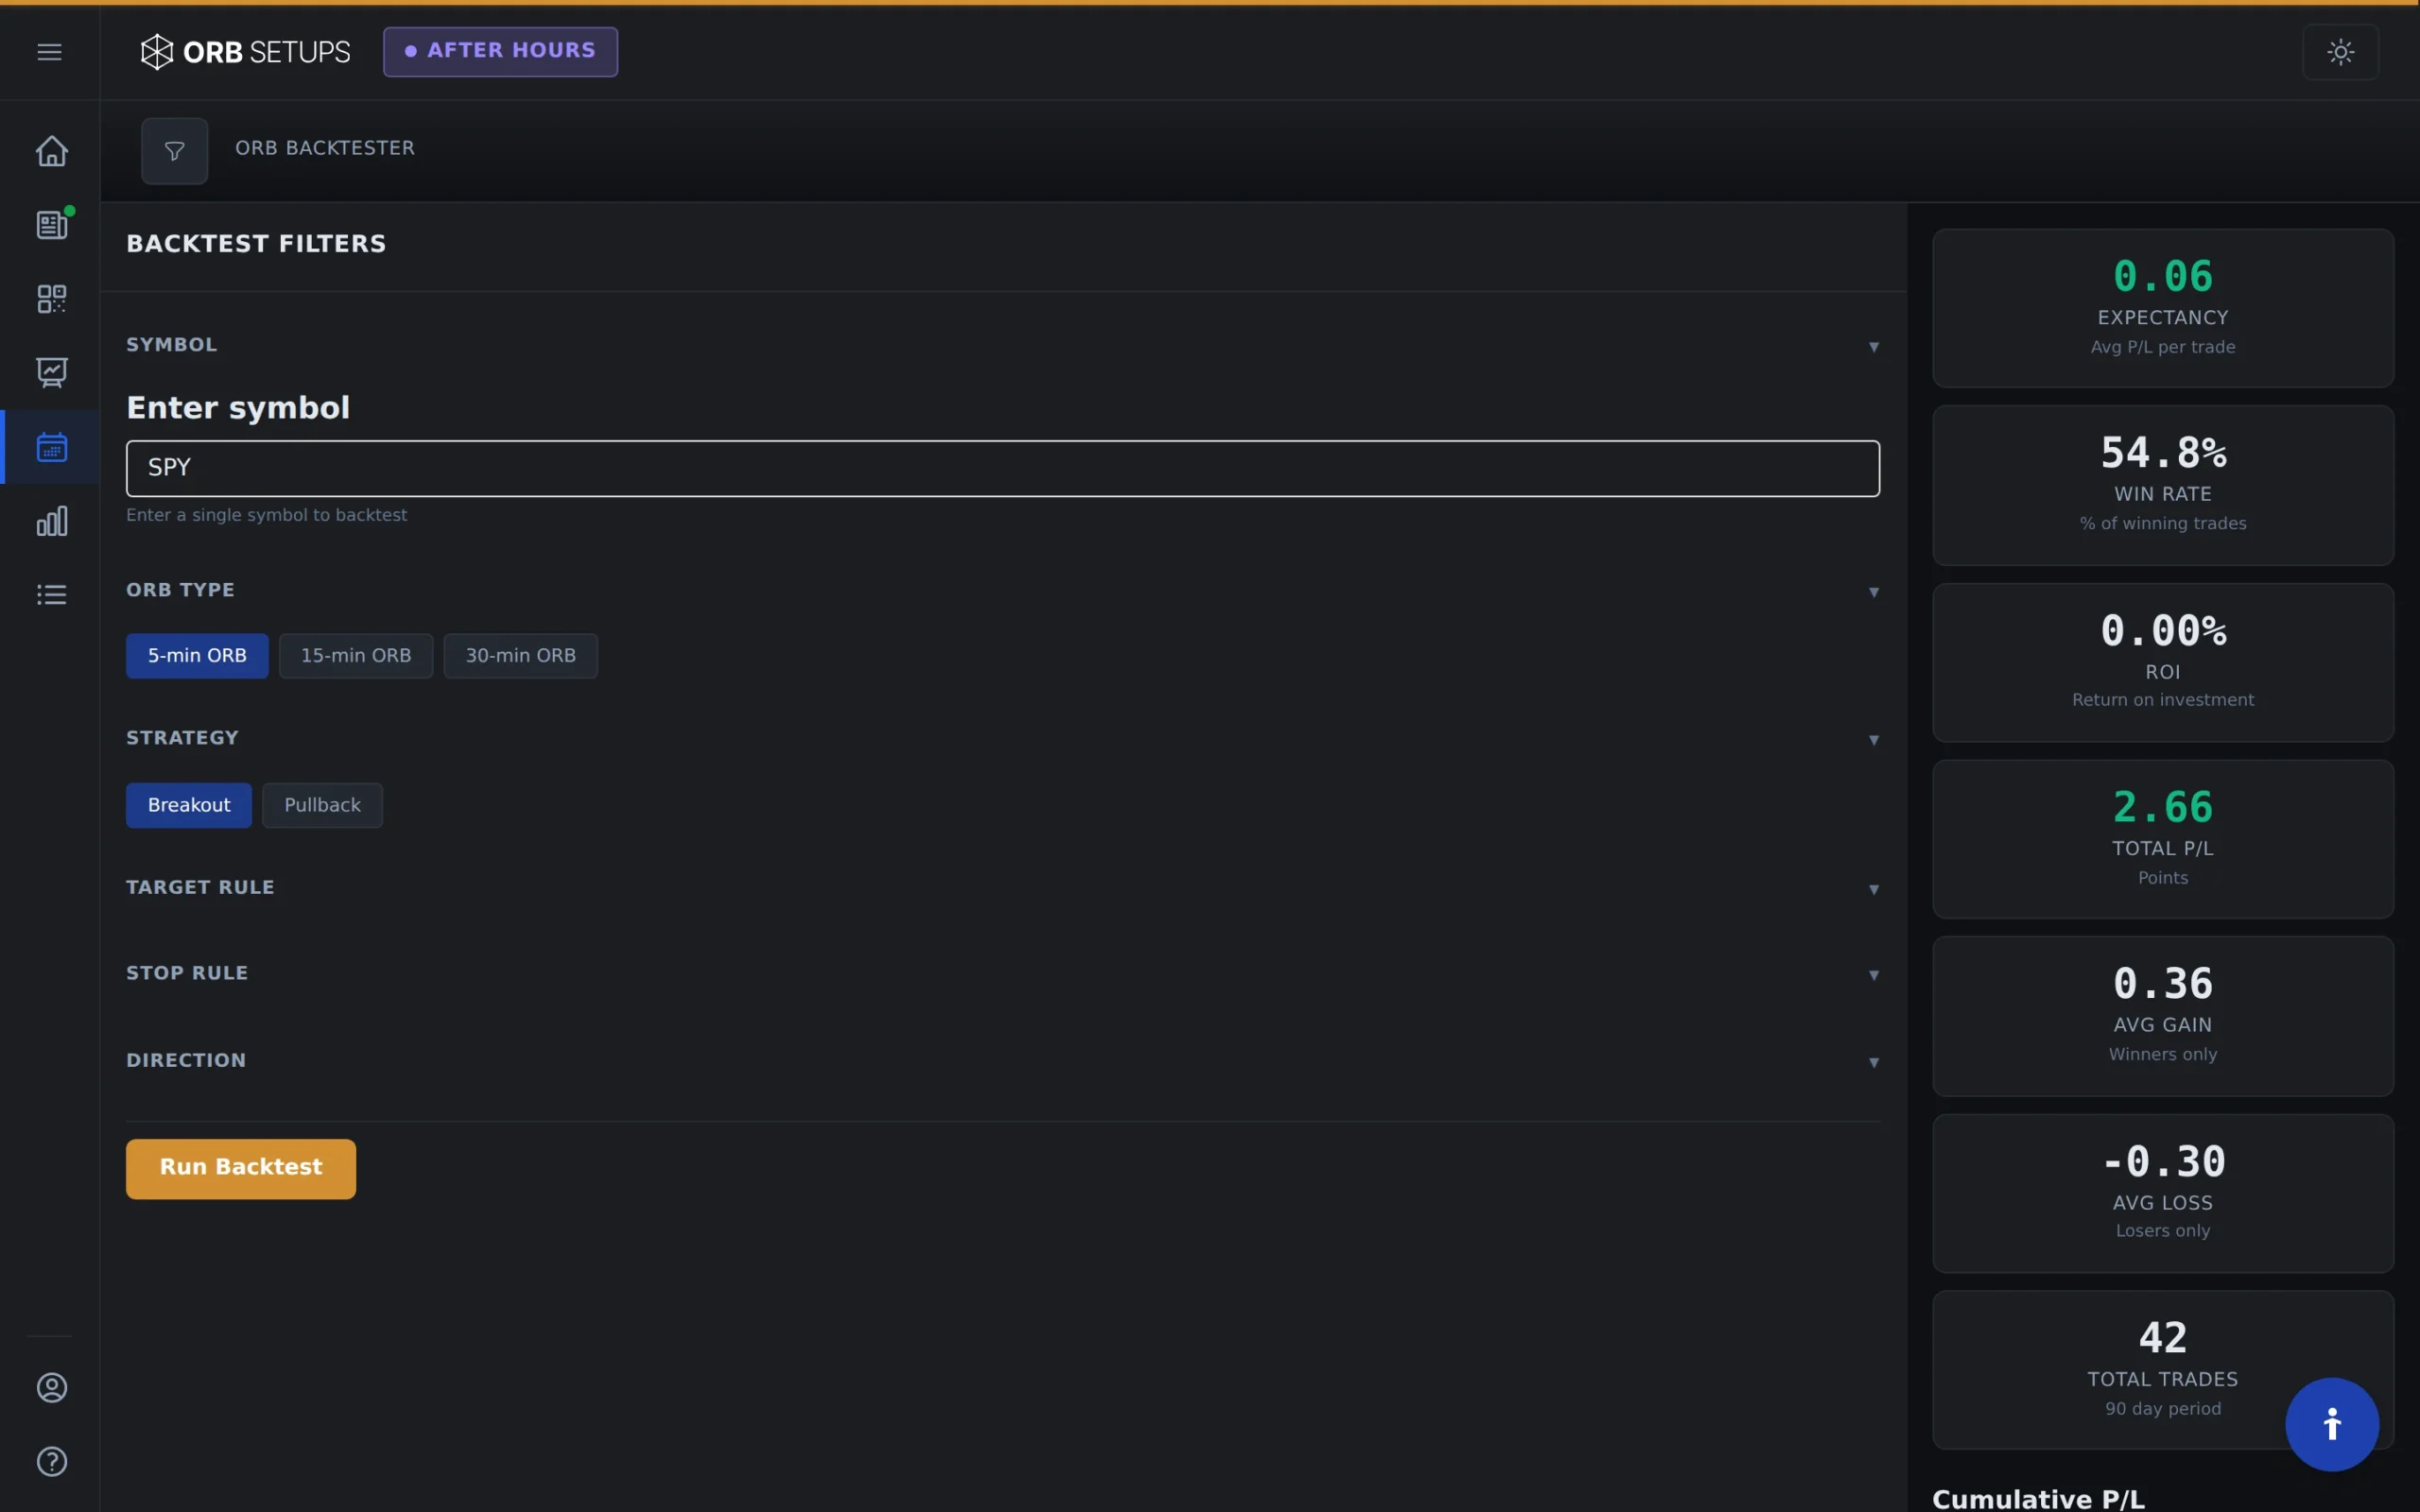
After running a backtest on any of the 600+ symbols in ORB Setups, you’ll get a detailed report showing exactly how your strategy performed. The backtester draws from over 1.6 million historical trades across 5, 15, and 30-minute opening range timeframes, giving you statistically meaningful results.
This guide walks you through each section of the backtest report so you can interpret the data and make informed decisions about your trading strategy.

Performance Summary
The top section of your backtest report provides the key metrics at a glance. These numbers tell you whether a strategy has historical edge before you risk any capital.
Trade Expectancy
This is the average dollar amount you can expect to make (or lose) per trade. The backtester calculates this by dividing total P/L by the total number of trades. A positive expectancy (shown with a green indicator) means the strategy has been profitable on average.
Win Rate
Win rate shows the percentage of trades that closed profitably. The calculation is straightforward: winning trades divided by total trades. A win rate above 50% displays a green indicator, though keep in mind that win rate alone doesn’t determine profitability. A 40% win rate can still be profitable if average gains exceed average losses.
Strategy ROI
This metric shows your total return on investment assuming a 1-share position per trade with commission-free execution. It’s calculated by dividing total strategy P/L by total capital deployed. Use this to compare performance across different symbols and timeframes.
Strategy P/L
The cumulative profit or loss across all trades in the backtest period. This raw number shows you the total dollar outcome of the strategy over the historical data set.
Average Gain and Average Loss
These two metrics show the average profit on winning trades and the average loss on losing trades. Compare these numbers to understand the risk/reward profile of your strategy. A healthy ratio typically shows average gains that exceed average losses.
Filtering by Trade Direction
You can break down performance by long trades only or short trades only. This is useful when you want to:
- See if a strategy works better in one direction
- Identify symbols with a bullish or bearish bias in ORB setups
- Focus on longs-only or shorts-only if your broker has restrictions
- Compare directional performance across different market conditions
Toggle between “All Trades,” “Longs Only,” and “Shorts Only” to see how the metrics change for each direction.
P/L Over Time Chart
The equity curve shows how your strategy’s cumulative P/L changed over the backtest period. This visualization helps you understand:
- Consistency: A steadily rising curve suggests consistent performance. Sharp spikes or drops indicate volatility in results.
- Drawdowns: Look for the deepest dips below previous highs. This shows the maximum drawdown you would have experienced trading this strategy.
- Trend: An upward-sloping curve confirms positive expectancy over time. A flat or declining curve signals a strategy that may not have edge.
Pay attention to how the curve behaves during different market periods. A strategy that only worked in bull markets may struggle when conditions change.
Full Trade Log
At the bottom of the report, you’ll find a complete table of every trade that triggered during the backtest. With over 150,000 historical setups in the database, some backtests may show hundreds or thousands of individual trades.
You can filter this table by:
- Direction: Longs only or shorts only
- Outcome: Winners only or losers only
Trade Log Columns
Each row in the trade log contains the following data:
- Symbol: The ticker for the traded security
- Date: The date the trade was executed
- ORB: The opening range timeframe (5, 15, or 30 minutes)
- Long/Short: The direction of the trade
- Entry Time: When the position was opened
- Entry Price: The price at entry
- Exit Time: When the position was closed
- Exit Price: The price at exit
- Duration: How long the trade was held (in minutes)
- Range: The width of the opening range in dollars
- P/L ($): Dollar profit or loss
- P/L (%): Percentage return on the trade
Using Backtest Data to Refine Your Strategy
The backtest report gives you the raw data. Here’s how to turn that data into actionable insights:
Compare Across Timeframes
Run the same strategy on 5-minute, 15-minute, and 30-minute opening ranges. Some symbols perform better with tighter ranges (5-min), while others need more room to develop (30-min).
Test Multiple Symbols
With 600+ symbols available, you can identify which stocks and ETFs have the strongest historical ORB performance. Look for symbols with high win rates, positive expectancy, and large sample sizes.
Examine Losing Trades
Filter the trade log to show only losing trades. Look for patterns: Are losses clustered on certain days? Do they happen more often in one direction? Understanding why trades fail helps you add filters to improve results.
Check Sample Size
A 70% win rate on 10 trades doesn’t mean much. A 55% win rate on 500 trades is statistically significant. The backtester pulls from 2 years of 1-minute candle data, so most symbols will have meaningful sample sizes.
Next Steps
Once you’ve analyzed your backtest results and found a strategy with positive expectancy, you can:
- Save the setup to your custom watchlist for live monitoring
- Use the live scanner (with 2-second refresh) to catch these setups in real time
- Review Trade Cards for auto-calculated entry, target, and stop levels
- Compare results across multiple symbols to build a diversified ORB watchlist
The backtester exists so you can validate strategies before risking real capital. Use it to find setups with documented edge, then execute with confidence when those setups appear in live trading.