Backtesting Multiple Symbols
Backtest Multiple Symbols at Once
The ORB Setups backtester lets you test up to 5 symbols in a single backtest. When you run a multi-symbol test, the strategy report combines performance data from all selected symbols into one aggregate report.
This saves you time and shows you how a basket of stocks performs under your specific ORB parameters, rather than testing each symbol individually.
How to Select Multiple Symbols
Follow these steps to run a multi-symbol backtest:
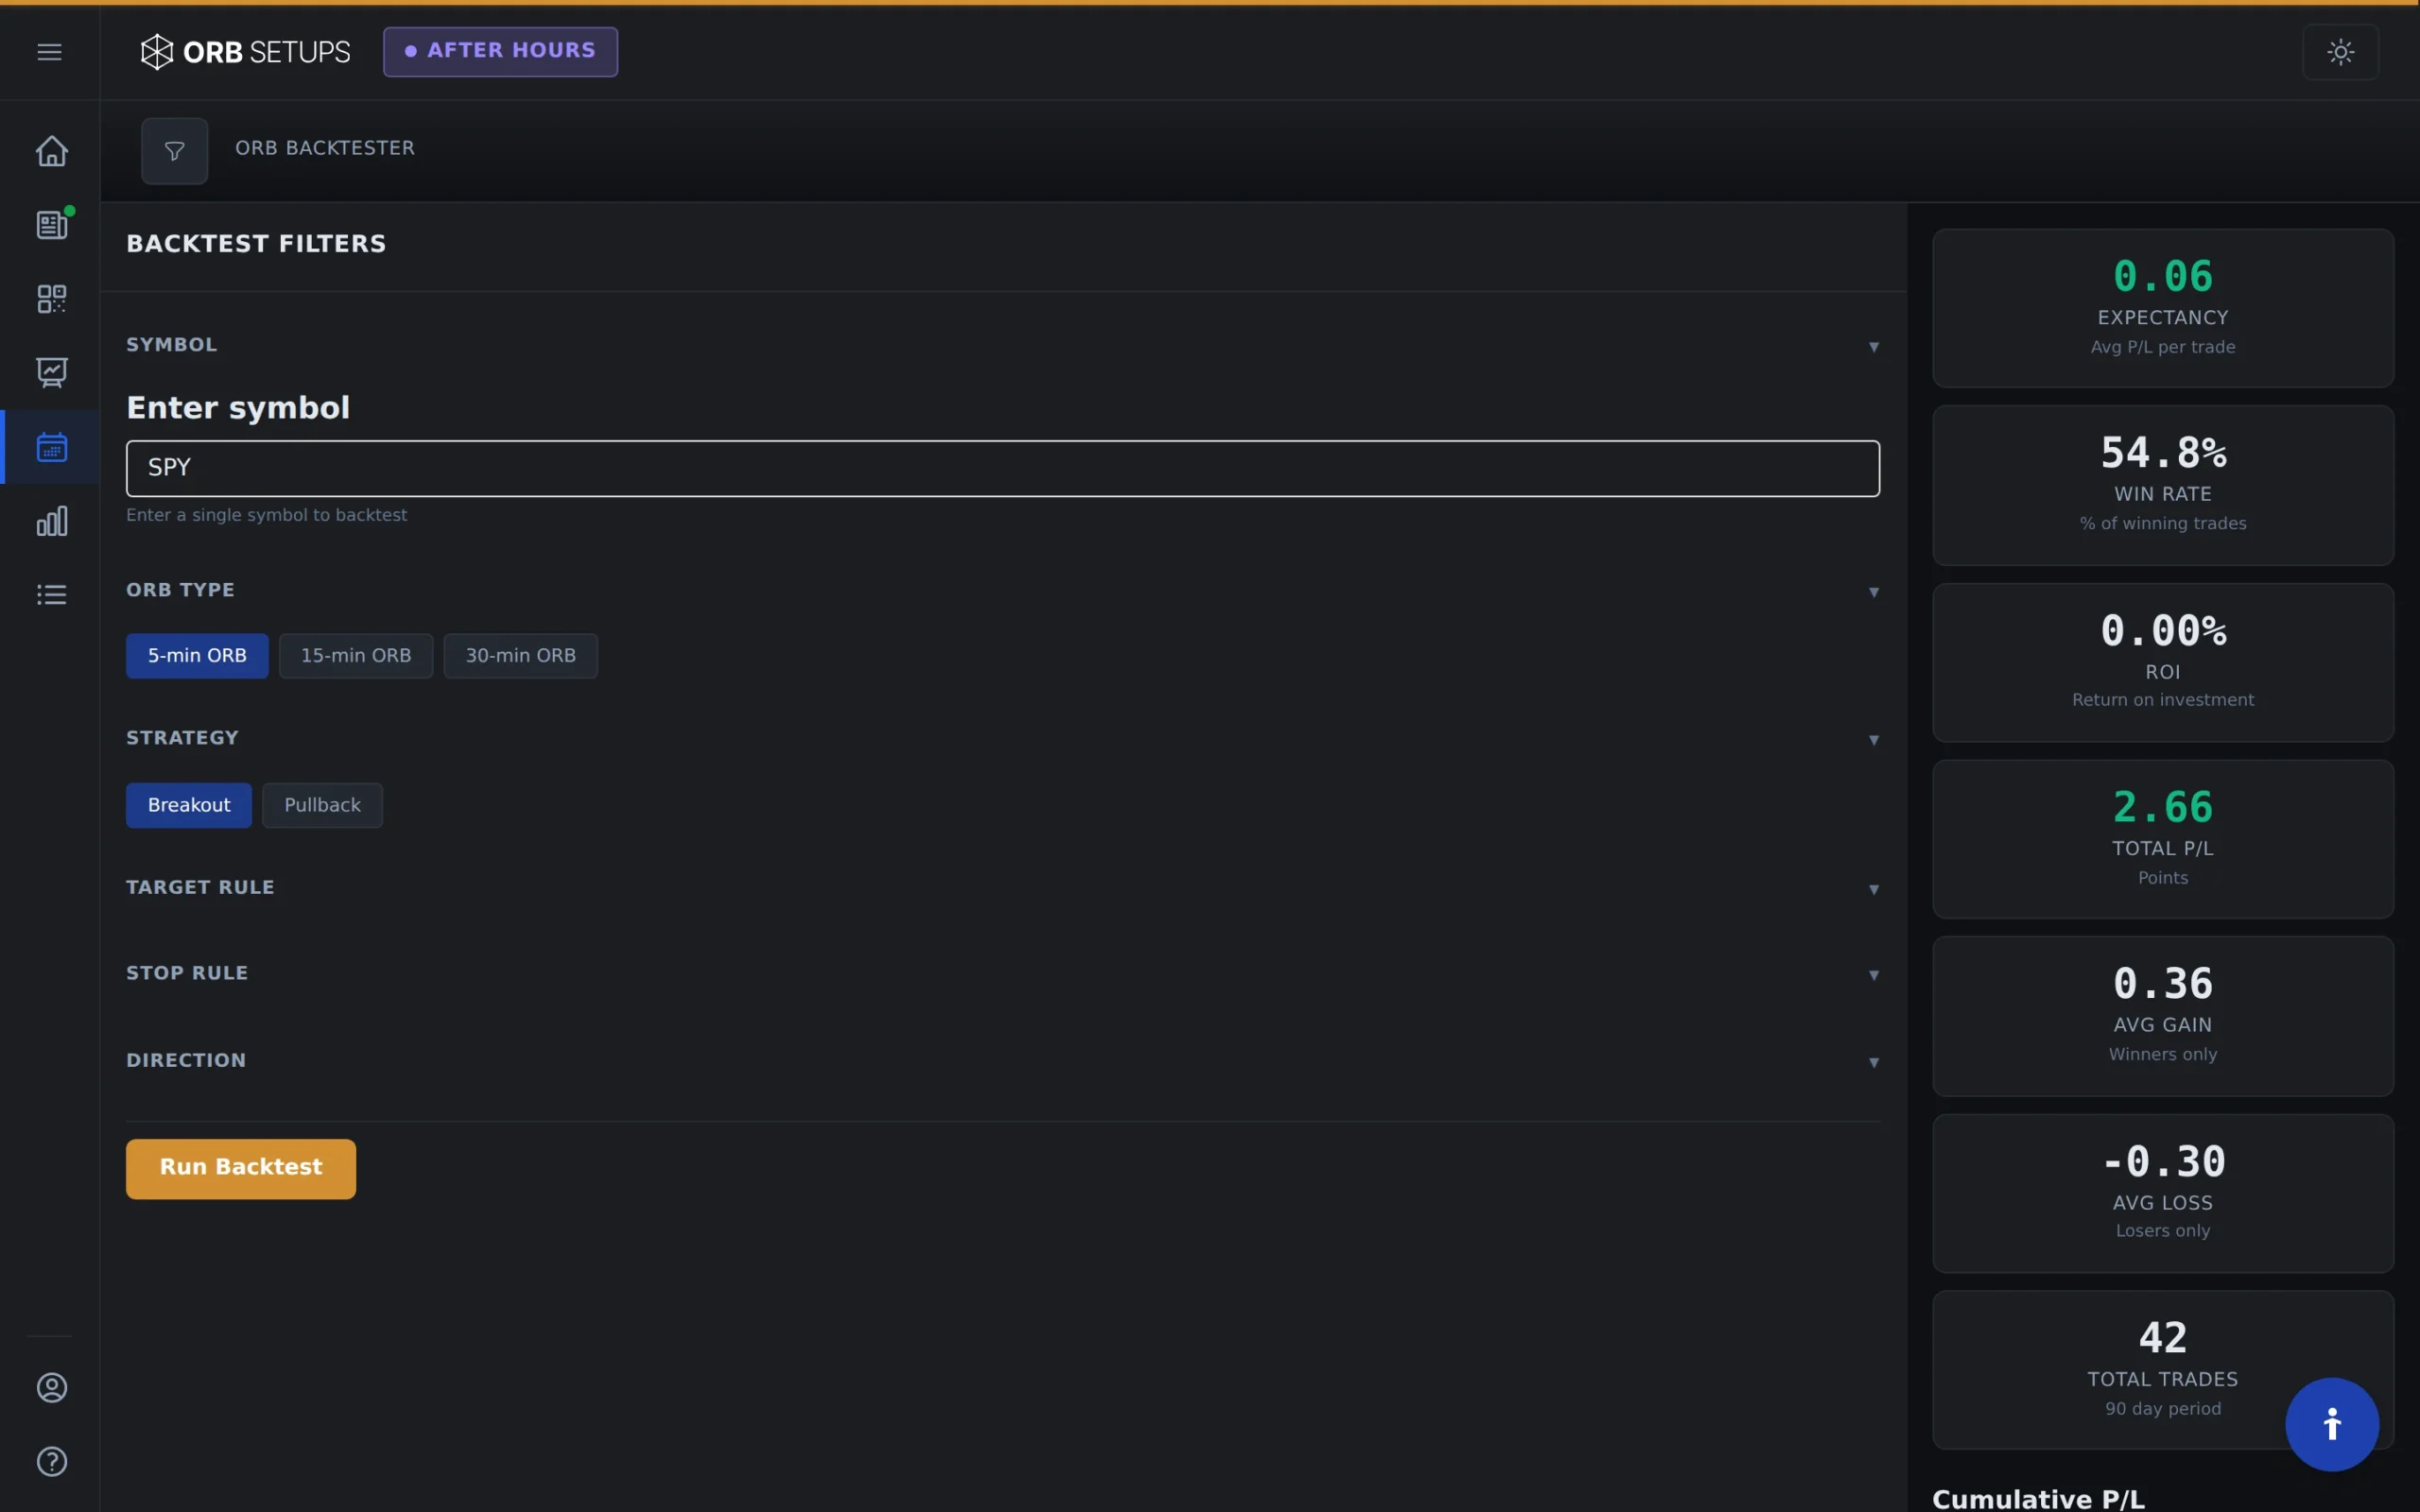
- Open the Backtester and locate the Symbols input field
- Enter your symbols separated by commas (up to 5 symbols per backtest)
- Set your parameters including timeframe (5, 15, or 30-minute ORB), date range, and any filters
- Click Search to run the backtest
The backtester pulls from over 1.6 million backtested trades across 600+ symbols, so you can test combinations across the full symbol universe.
When to Use Single vs. Multiple Symbol Backtests
Single Symbol Backtests
Use single symbol backtests when you want to:
- Analyze one stock’s ORB performance in detail
- Compare how different timeframes (5/15/30-min) perform on the same symbol
- Study a specific symbol’s historical win rate and expectancy
Multiple Symbol Backtests
Use multiple symbol backtests when you want to:
- Test how a group of related stocks performs together
- Build a watchlist based on combined performance data
- Understand aggregate win rates across a sector or basket
Pro Tip: Test Correlated Symbols Together
Multi-symbol backtests work best when your symbols share some correlation. This gives you insight into how a trading basket performs as a unit.
Example: Backtest SPY, QQQ, IWM, and DIA together to see how the major index ETFs have performed with the ORB strategy over your selected date range. This shows you aggregate statistics across the broad market rather than just one index.
Other useful baskets to test:
- Tech leaders: AAPL, MSFT, GOOGL, AMZN, NVDA
- Semiconductor stocks: AMD, NVDA, INTC, MU
- Financial sector: JPM, BAC, GS, MS
- High-volume day trading favorites: TSLA, SPY, QQQ, AMD, NVDA
Reading Your Multi-Symbol Report
When your backtest completes, the strategy report shows combined metrics for all symbols:
- Total trades: Sum of all ORB setups across your selected symbols
- Win rate: Aggregate percentage of winning trades
- Average P/L: Combined profit/loss per trade
- Expectancy: Your expected return per trade based on historical data
This aggregate view helps you decide whether to trade a basket of symbols or focus on individual performers within the group.