False Breakouts
What Is a False Breakout?
A false breakout occurs when price moves beyond the opening range level, triggers your entry, and then reverses back into the range. The trade looks good for a moment, then fails. Your stop gets hit, and you’re left wondering what went wrong.
False breakouts are part of trading. They happen to everyone. The goal isn’t to eliminate them completely. It’s to reduce their frequency and limit the damage when they occur.
Here’s how to identify and manage false breakouts in your ORB trading.
How to Identify False Breakouts
Confirm the Breakout with Volume
Volume is your first confirmation signal. A genuine breakout typically shows increased volume as price pushes through the opening range level. This indicates real participation behind the move.
When you see a breakout on low or average volume, be cautious. The move may lack the momentum needed to reach your target.
Check volume on your charting platform when a setup triggers. Look for a clear volume spike on the breakout candle compared to the candles that formed the opening range.
Watch for Retests of the Breakout Level
Price behavior after the initial breakout tells you a lot about the quality of the move. Some traders wait for a retest before entering.
Here’s what to watch for:
- Successful retest: Price breaks out, pulls back to the breakout level, holds above it, then continues in the breakout direction. This is a higher-probability entry point.
- Failed retest: Price breaks out, pulls back to the breakout level, and falls back into the range. This signals a false breakout. Exit the trade or avoid entry if you haven’t entered yet.
Waiting for a retest means you’ll miss some fast-moving breakouts. But you’ll also avoid many false ones. It’s a trade-off worth considering, especially in choppy markets.
Use Historical Win Rates to Filter Setups
Not all symbols have the same breakout characteristics. Some stocks produce clean breakouts consistently. Others generate more false signals.
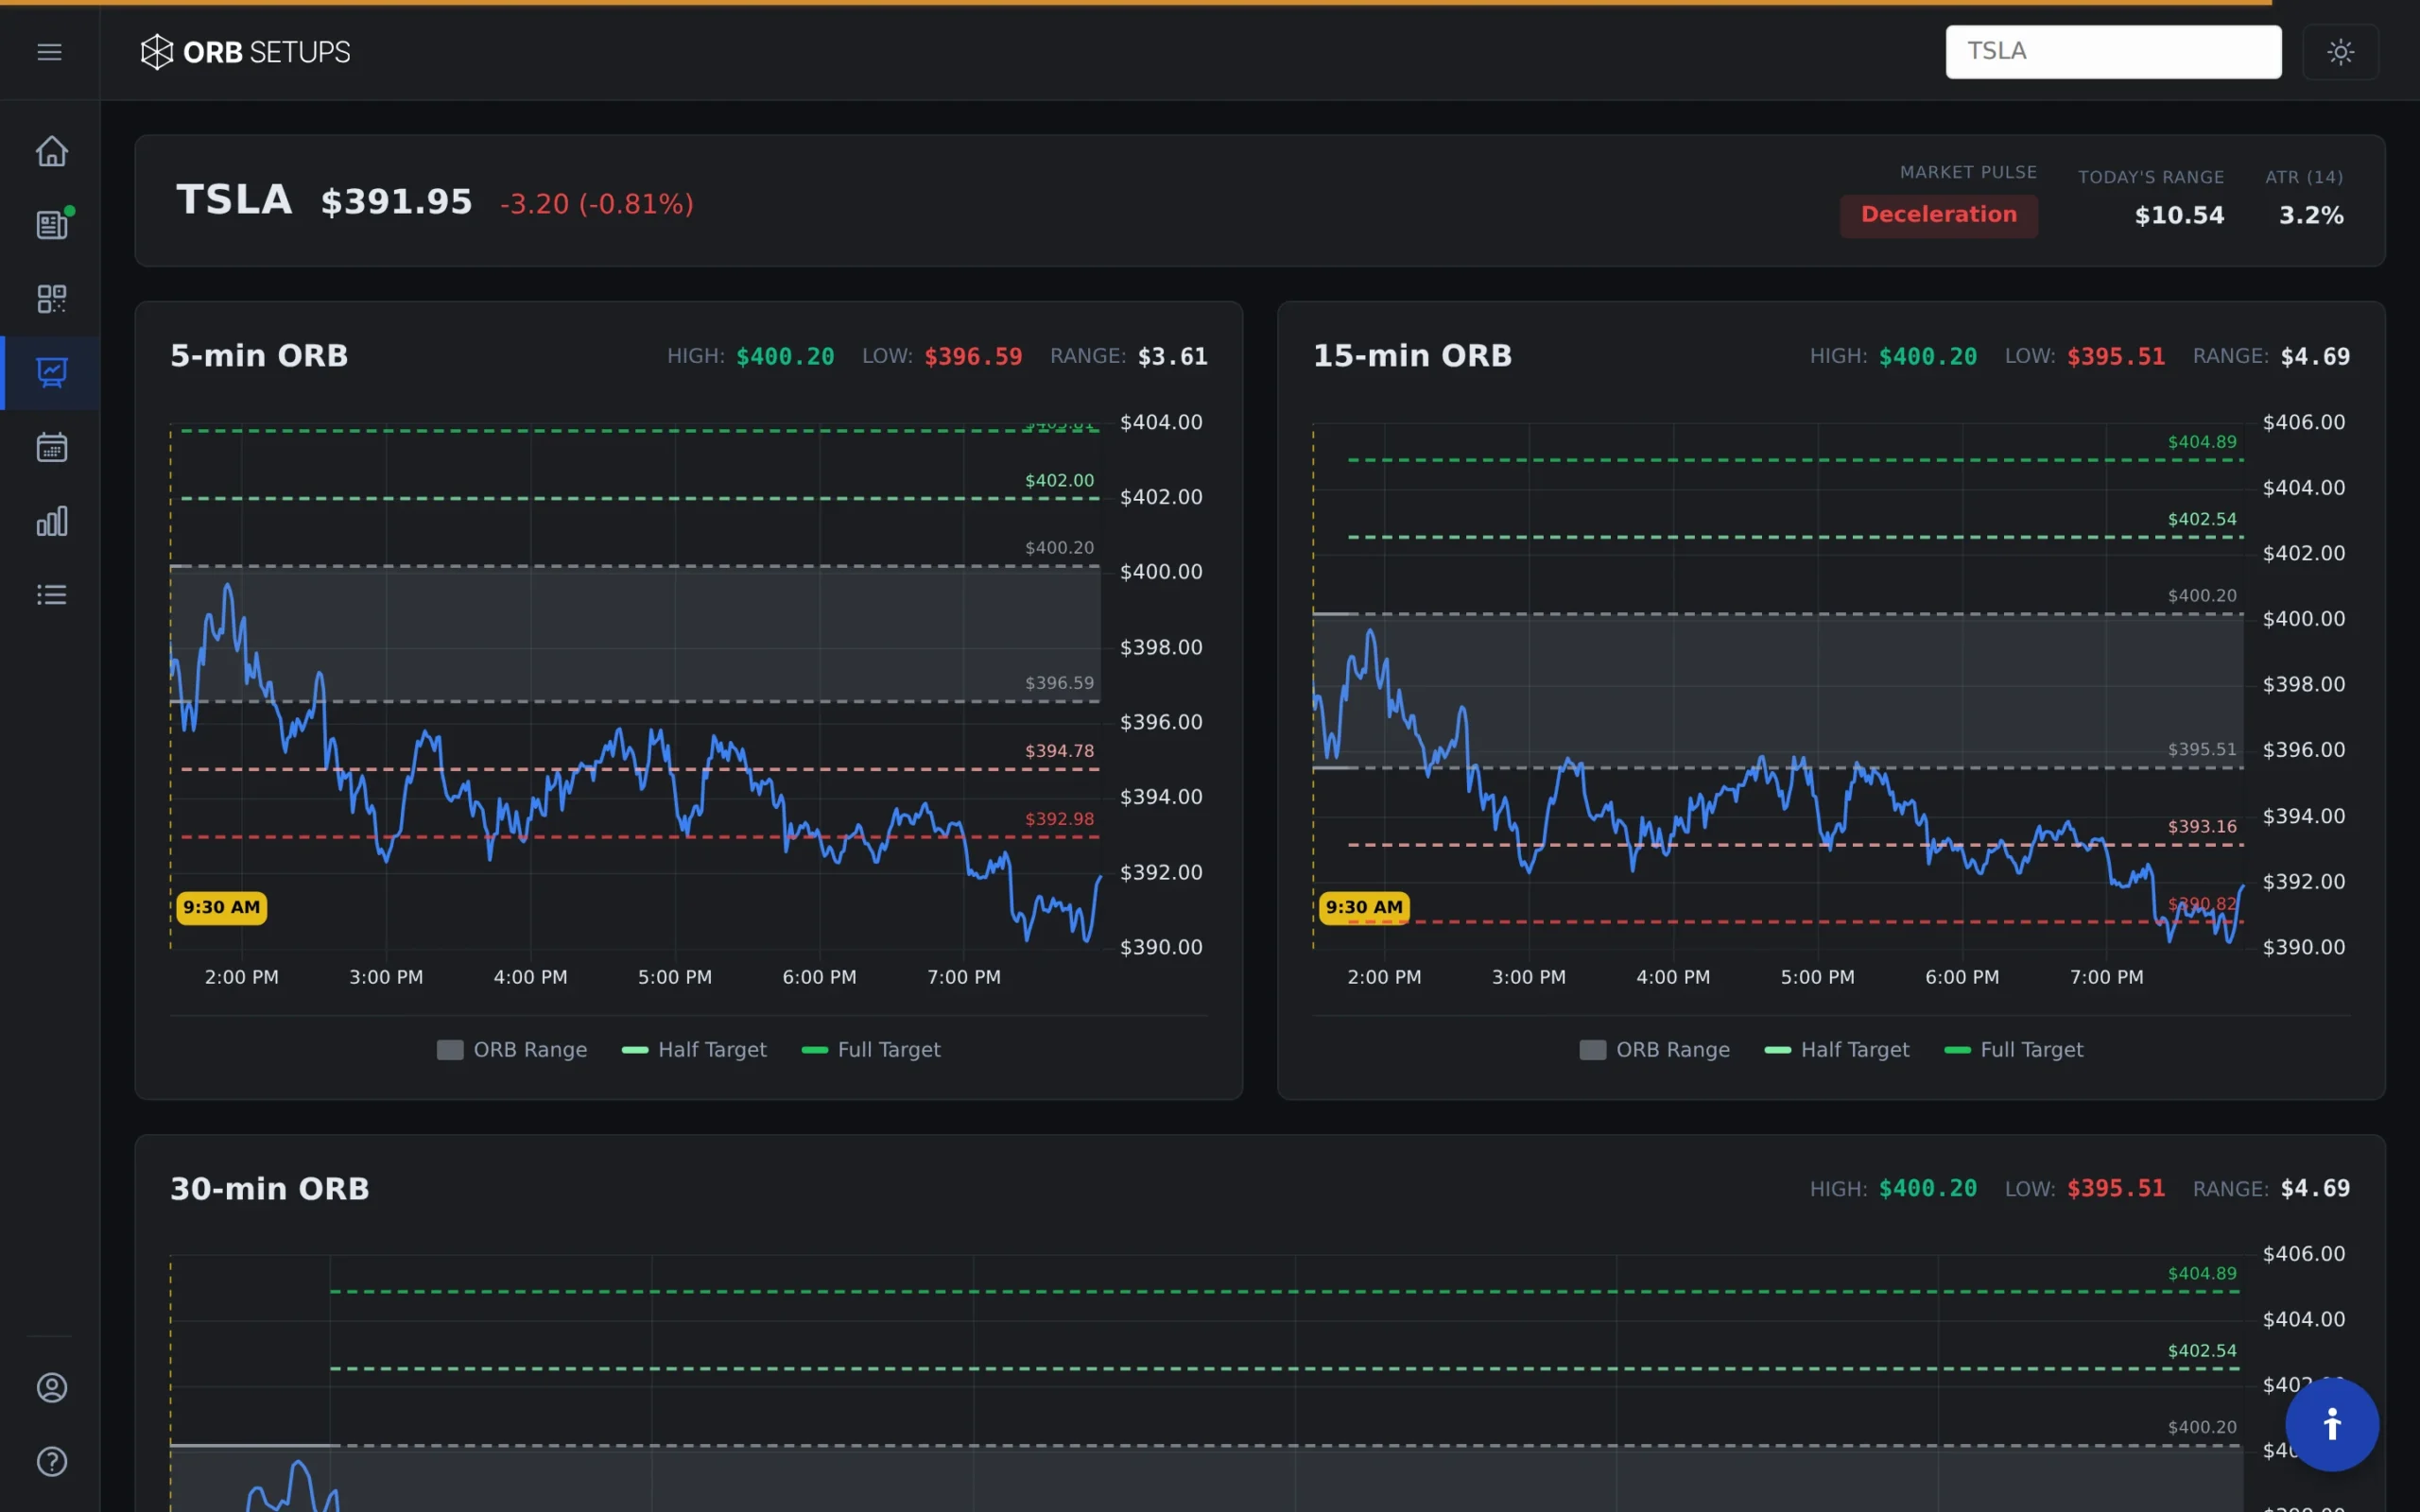
ORB Setups scans 600+ symbols with a 2-second refresh rate, showing you live breakout setups across 5, 15, and 30-minute timeframes. Each setup displays historical performance data drawn from 150,000+ historical setups and 1.6M backtested trades.
Before entering any trade, check the historical win rate for that symbol and timeframe. A setup with a 65% historical win rate deserves more confidence than one showing 45%.
You can build custom watchlists focused on symbols with the strongest historical breakout performance. This pre-filtering reduces your exposure to symbols prone to false breakouts.
Managing False Breakouts When They Happen
Set Your Stop Before Entry
Every ORB trade needs a defined stop loss. Place it on the opposite side of the opening range. When a breakout fails, your stop limits the damage.
The ORB Setups Trade Cards calculate your entry, stop, and target automatically based on the opening range. Use these levels rather than improvising in the moment.
Accept the Loss and Move On
A stopped-out trade is not a failure if you followed your plan. False breakouts are a cost of doing business with the ORB strategy. What matters is your performance over many trades, not any single result.
Track your trades. Review your win rate and expectancy across 20, 50, or 100 setups. The backtester shows you what to expect historically. Your actual results should align with those numbers over time.
Scheduled Events and False Breakouts
Economic data releases create volatility spikes that can trigger breakouts in many stocks simultaneously. These moves often reverse quickly once the initial reaction fades.
Be aware of the market calendar:
- CPI, jobs data, Fed announcements: These reports move the entire market. Breakouts triggered during or immediately after these events carry higher false breakout risk.
- Earnings releases: Individual stock earnings can cause gaps and breakouts that reverse as traders digest the news.
- Market open: The first few minutes after 9:30 AM ET are noisy. Many traders wait for the opening range to form rather than trading the initial volatility.
Check a calendar like Forex Factory for economic events (look for red-folder items). Use Earnings Whispers to track earnings dates for stocks on your watchlist.
Build a Cheat Sheet for Your Watchlist
Spend a few minutes each week running backtests on your favorite symbols. The ORB Setups backtester lets you see performance across different timeframes and market conditions.
Create a simple scorecard:
- Symbol
- Timeframe (5-min, 15-min, or 30-min ORB)
- Historical win rate
- Average P/L per trade
- Current streak (wins or losses)
This helps you focus on setups with positive expectancy and avoid symbols where the ORB strategy hasn’t been working recently.
Key Takeaways
- False breakouts are normal. Your job is to reduce them and manage risk when they happen.
- Volume confirms breakout quality. Low-volume breakouts are more likely to fail.
- Retests give you a second chance to evaluate the setup before committing.
- Historical data helps you filter. Use win rates from 150,000+ historical setups to choose better trades.
- Economic events increase false breakout risk. Know the calendar.
- Keep a scorecard. Track which symbols work best for your strategy.
The ORB Setups scanner and backtester give you the data to make informed decisions. With 600+ symbols updating every 2 seconds and performance metrics on every setup, you can focus on the breakouts most likely to follow through.