Examples
The ORB Setups platform gives you powerful tools for finding high-probability opening range breakout setups. This guide walks you through practical examples of how to use the Live Scanner, Charts, and Backtester to identify and validate your trades.
Using the Live Scanner
The Live Scanner monitors 600+ symbols with a 2-second refresh rate, identifying setups across 5-minute, 15-minute, and 30-minute opening ranges in real time. Here are some practical ways to use it:
Filtering by Win Rate
By default, the win rate filter is set to 75%. If you are scanning a smaller watchlist (like the DOW 30) and not seeing any triggers, your filters may be too restrictive for current market conditions.
To widen your results:
- Lower the win rate requirement to 70% or 65%
- This will surface more setups while still maintaining a statistical edge
- The scanner draws from 150,000+ historical setups and 1.6M backtested trades, so even a 65% threshold is based on substantial data
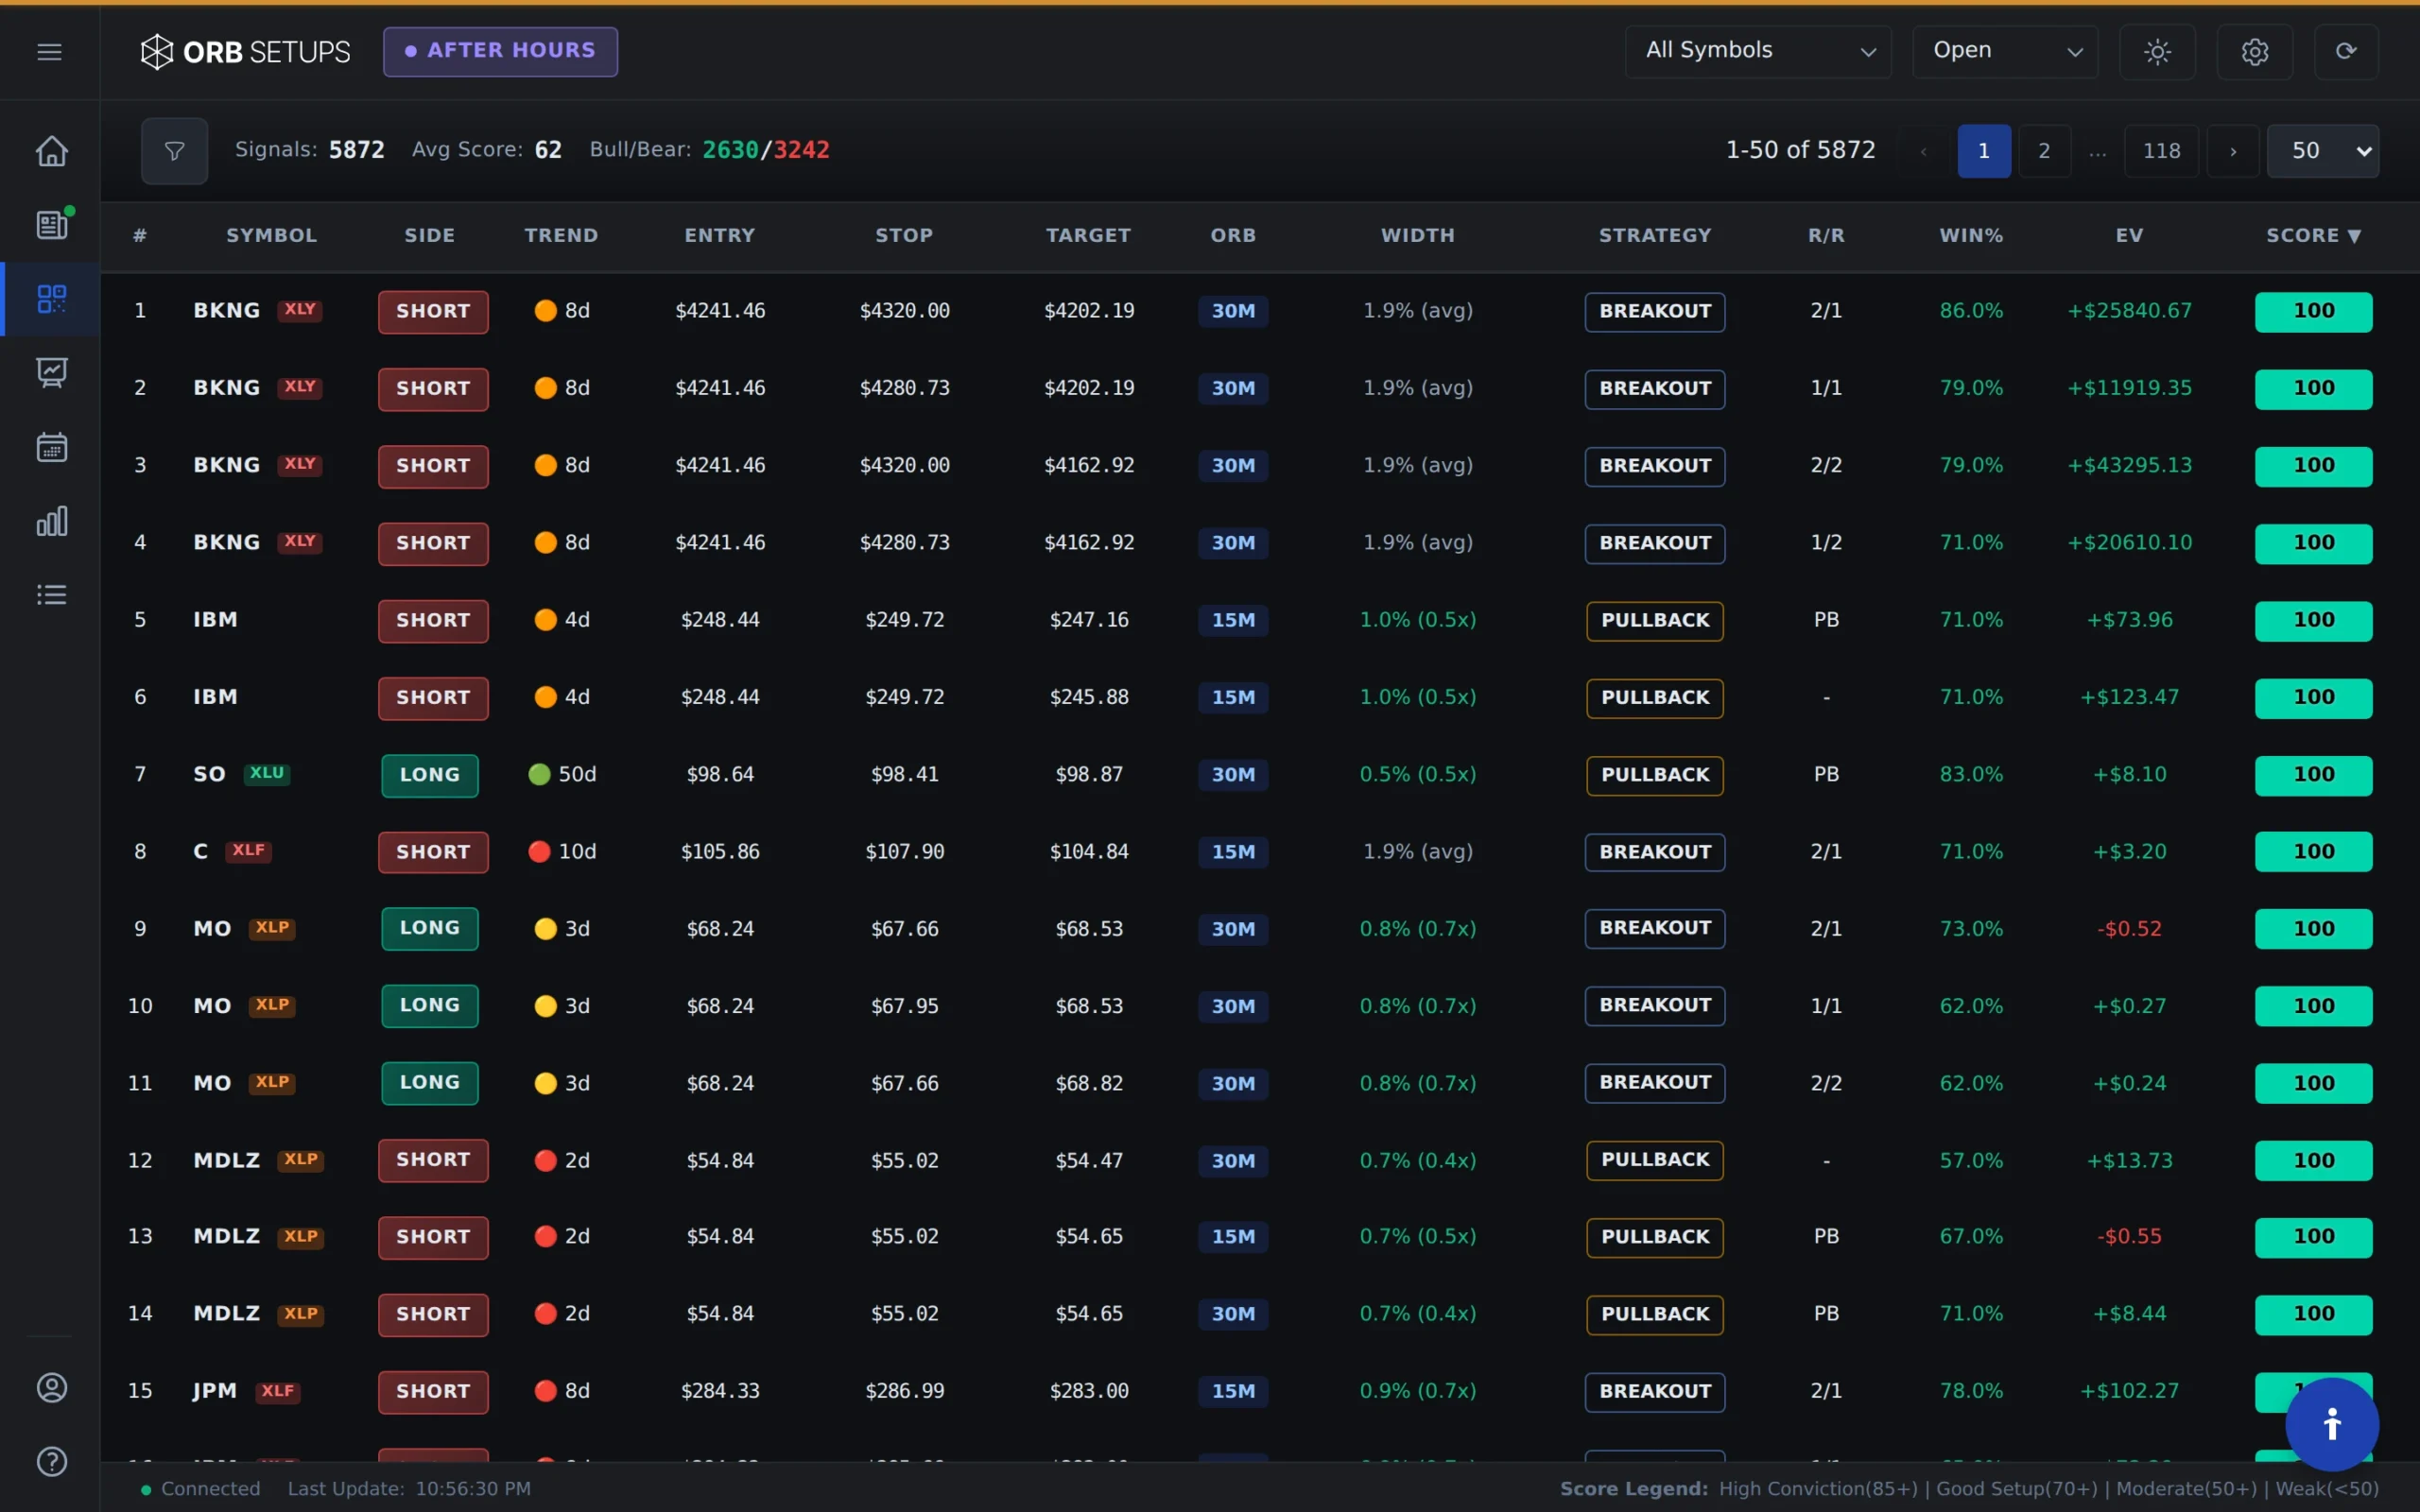
Finding Favorable Risk/Reward Setups
You can configure the scanner to show only trades that meet specific risk/reward criteria. For example:
- Set your stop to a half-range
- Set your target to a full-range
- The scanner will automatically display trades with a 1:2 risk/reward ratio that also meet your win rate and P/L filters
This approach helps you find setups where the math works in your favor, without manually scanning through hundreds of symbols.
Sorting by Sample Size
If you want to prioritize setups with more historical data points, sort by the Win-Loss column. This lets you find trades with consistently high win rates backed by larger sample sizes, giving you more confidence in the statistical reliability of each setup.
Analyzing Charts
Once you identify a setup in the Live Scanner, the Charts feature lets you visualize the opening range and breakout levels. You can see:
- The opening range boundaries for your selected timeframe (5, 15, or 30 minutes)
- Breakout direction and timing
- Historical price action context

Charts help you validate whether a setup aligns with your trading plan before entering a position.
Running Backtests
The Backtester lets you test your ORB strategy parameters against historical data. With access to 150,000+ historical setups and 1.6M backtested trades, you can:
- Test different opening range timeframes (5, 15, or 30 minutes)
- Adjust stop and target parameters to see how they affect win rate and P/L
- Compare performance across different symbols or watchlists
- View trade expectancy and total P/L for each configuration

Example Backtest Workflow
Here is a simple workflow to test a strategy idea:
- Select your symbol or watchlist from the dropdown
- Choose your opening range timeframe (5, 15, or 30 minutes)
- Set your stop and target as multiples of the opening range
- Run the backtest to see win rate, average P/L, and trade count
- Adjust parameters and re-run to compare results
This process helps you find configurations that have historically performed well before you risk real capital.
Putting It All Together
A typical trading session using ORB Setups might look like this:
- Pre-market: Set up your watchlist and configure your filters in the Live Scanner
- Market open: Monitor the scanner as opening ranges form across your 600+ symbols
- Setup detection: When a setup triggers, review the chart to confirm it fits your criteria
- Validation: Check the backtest data for that specific setup to see historical win rate and expectancy
- Execution: Use the Trade Card for auto-calculated entry, target, and stop levels
The platform handles the scanning and calculations so you can focus on execution and risk management.